Fig. 6
Download original image
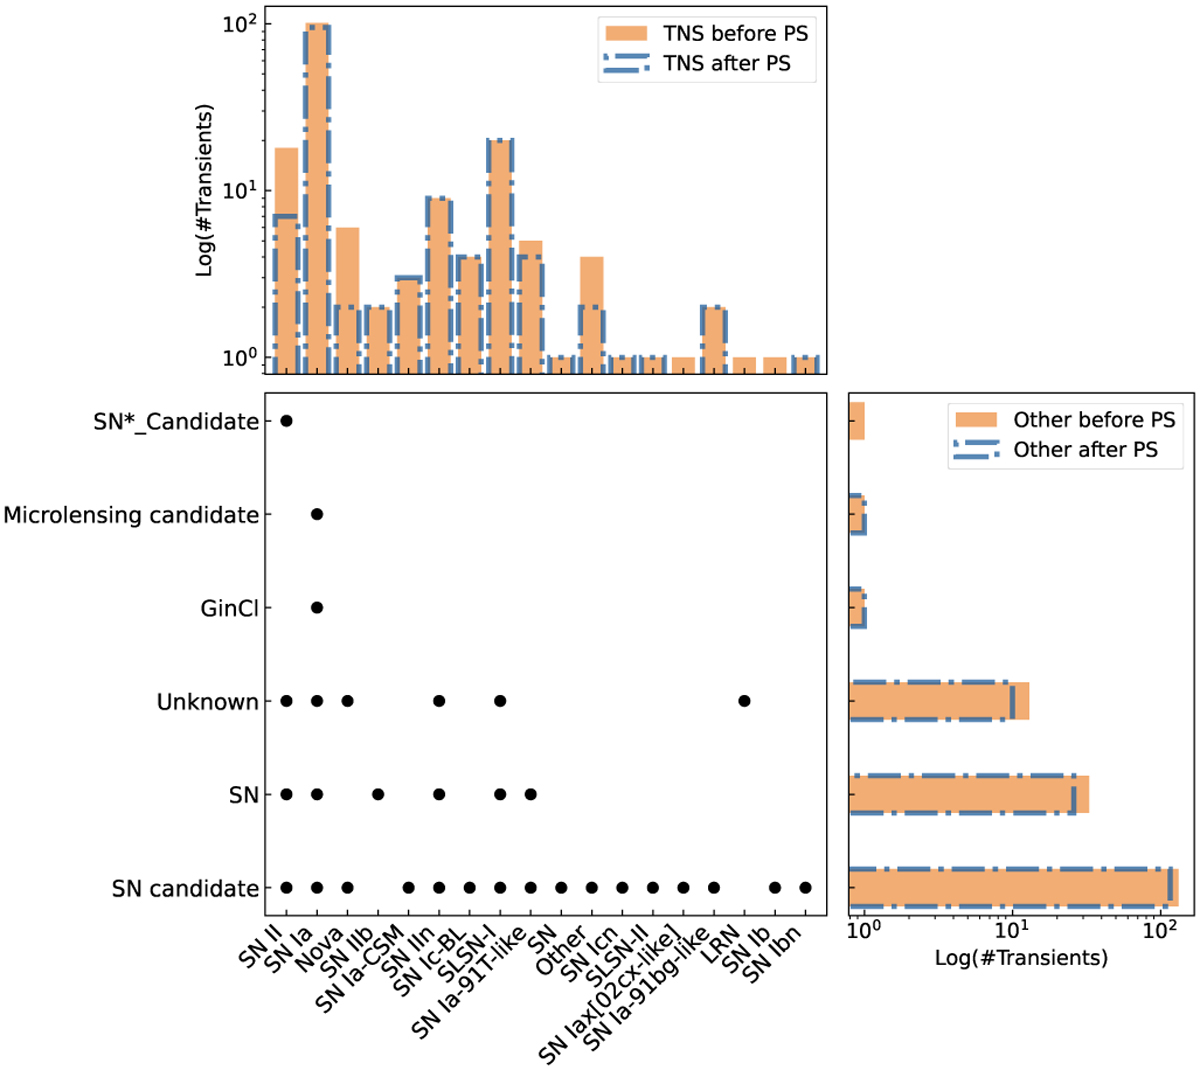
Classified events. Central panel: Black dots indicate the comparison between the spectral classification reported on TNS (horizontal axis) and the classification reported by Fink obtained from other sources (vertical axis). The classes on the vertical axis will match those presented in the corresponding classifying source. In this case, the “SN*_candidate” class is assigned by SIMBAD, whereas the “SN candidate” class is assigned by Fink. Both indicate a possible SN. “GinCl” is also assigned by SIMBAD and indicates a galaxy toward a cluster of galaxies. The x and y axis side panels show the number of transients considered to be hostless by the sigma clipping method before applying the power spectrum analysis (orange), and the number of surviving hostless candidates after applying the power spectrum analysis (blue).
Current usage metrics show cumulative count of Article Views (full-text article views including HTML views, PDF and ePub downloads, according to the available data) and Abstracts Views on Vision4Press platform.
Data correspond to usage on the plateform after 2015. The current usage metrics is available 48-96 hours after online publication and is updated daily on week days.
Initial download of the metrics may take a while.