Open Access
Fig. 1.
Download original image
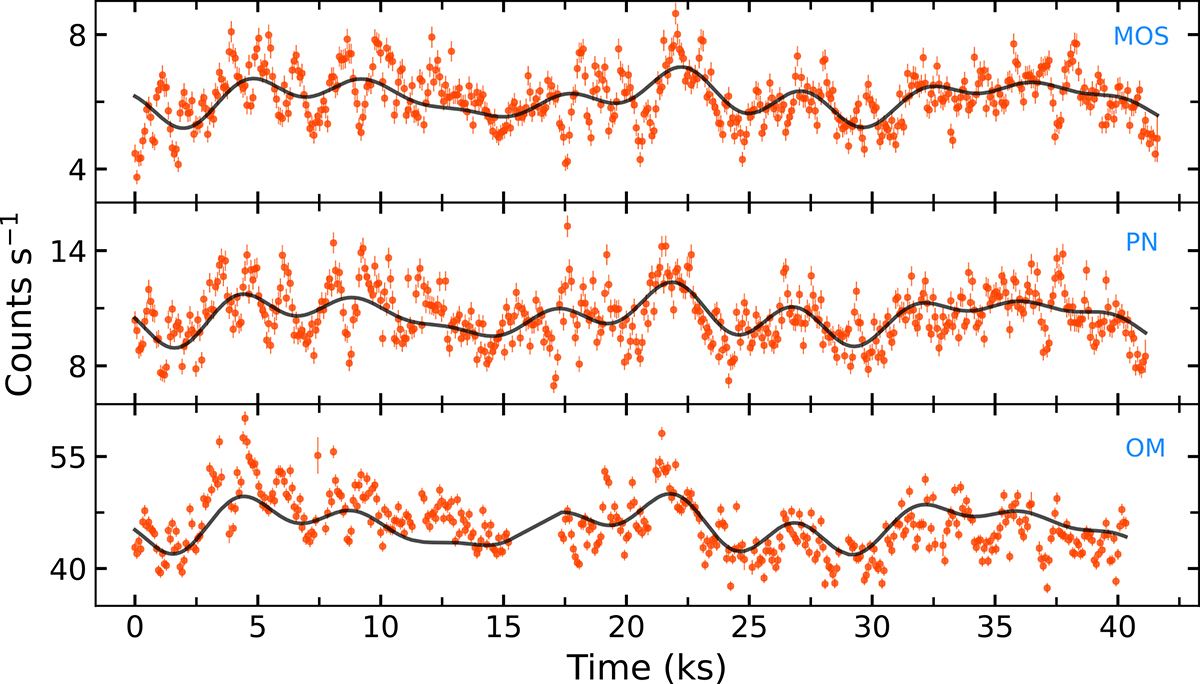
EPIC light curves in the 0.2–12.0 keV energy range and OM light curve in B filter binned in 80 s intervals for clarity purposes. The black solid line represents the multi-fit sinusoidal function comprising three frequencies present in the X-ray light curves.
Current usage metrics show cumulative count of Article Views (full-text article views including HTML views, PDF and ePub downloads, according to the available data) and Abstracts Views on Vision4Press platform.
Data correspond to usage on the plateform after 2015. The current usage metrics is available 48-96 hours after online publication and is updated daily on week days.
Initial download of the metrics may take a while.