Fig. C.1.
Download original image
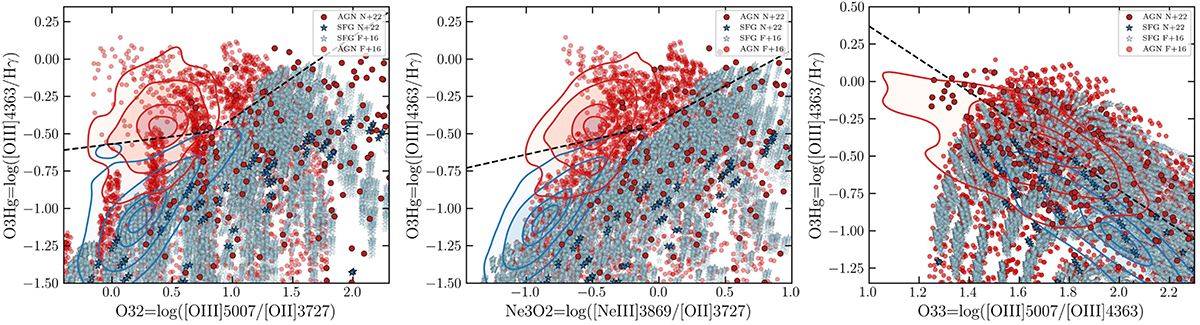
Same plots reported in the right panels of Fig. 1, Fig. 2 and Fig. 3 (from left to right), but showing all the models computed in Gutkin et al. (2016), Feltre et al. (2016), and Nakajima & Maiolino (2022), i.e. without the cut described in Sect. 2.3. The demarcation lines for the O3Hg-O32 and O3Hg-Ne3O2 still hold, while there is an almost complete superposition between SFG and AGN models in the O3Hg-O33 diagnostic diagram.
Current usage metrics show cumulative count of Article Views (full-text article views including HTML views, PDF and ePub downloads, according to the available data) and Abstracts Views on Vision4Press platform.
Data correspond to usage on the plateform after 2015. The current usage metrics is available 48-96 hours after online publication and is updated daily on week days.
Initial download of the metrics may take a while.