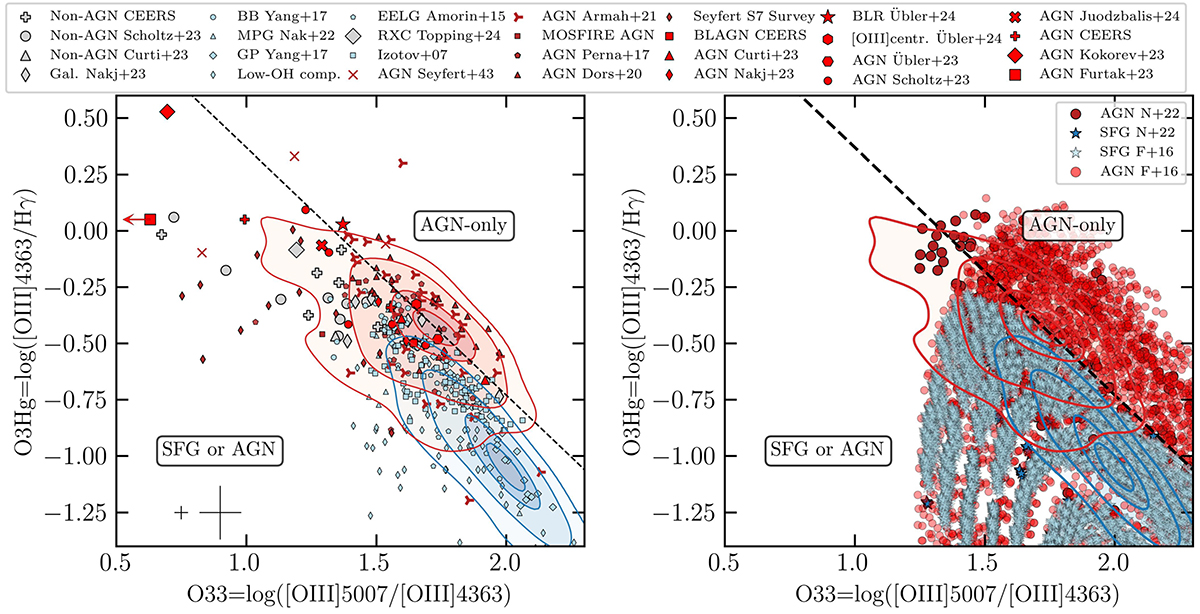
Fig. 3.
Download original image
Same as Fig. 1, but for the line ratios [OIII]λ4363/Hγ vs [OIII]λ5007 /[OIII]λ4363. In the left panel the arrow on the AGN reported in Furtak et al. (2023) is for visualization purposes only since it would be located at O33∼0. The cut in SFG models described in Sect. 2.3 allowed us to identify an AGN-only region of the diagnostic to the right of the black dashed line.
Current usage metrics show cumulative count of Article Views (full-text article views including HTML views, PDF and ePub downloads, according to the available data) and Abstracts Views on Vision4Press platform.
Data correspond to usage on the plateform after 2015. The current usage metrics is available 48-96 hours after online publication and is updated daily on week days.
Initial download of the metrics may take a while.