Fig. 10
Download original image
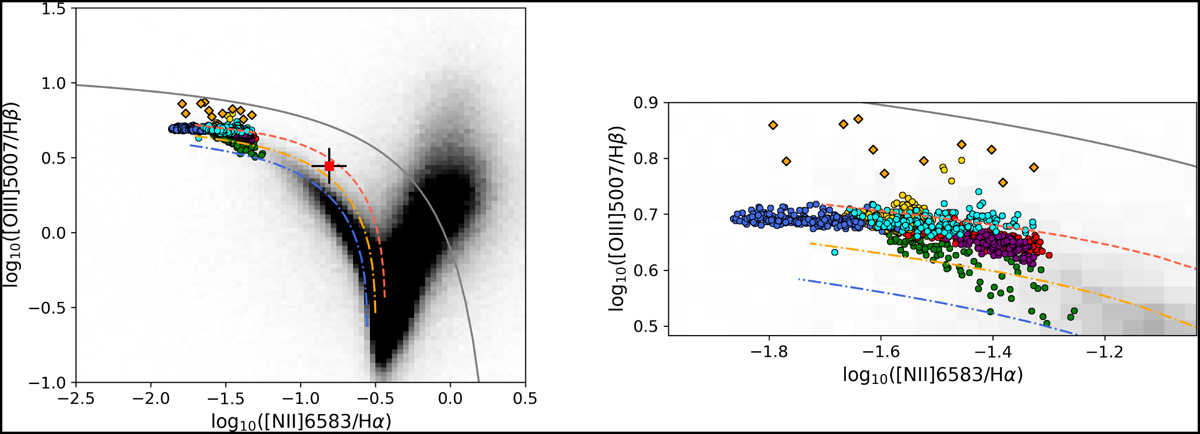
Distribution of the areas highlighted in Fig. 9 in the BPT diagram (Baldwin et al. 1981). The colored dots follow the color coding used in Fig. 9; the large red point represents the background-subtracted line ratios of the red region. The right panel zooms into the more general view displayed on the left. The BPT diagram extracted from the SDSS DR7 sample (Abazajian et al. 2009) is displayed in the background (gray shaded area) as a reference, together with the Kewley et al. (2001) maximum starburst line in both panels. Extreme Lyman-continuum-emitting green pea galaxies (orange diamonds), updated from Micheva et al. (2017), are also shown. Additionally, the observed regions are compared with numerical predictions using BPASS and CLOUDY (Xiao et al. 2018). The simulations were calculated using the Large Magellanic Cloud metallicity, an age of 1 Myr, and a hydrogen density log10 (nH[cm−3]) ranging between 2 (dotted-dashed blue line), 2.5 (dotted-dashed orange line), and 3 (dashed red line).
Current usage metrics show cumulative count of Article Views (full-text article views including HTML views, PDF and ePub downloads, according to the available data) and Abstracts Views on Vision4Press platform.
Data correspond to usage on the plateform after 2015. The current usage metrics is available 48-96 hours after online publication and is updated daily on week days.
Initial download of the metrics may take a while.