Fig. 5.
Download original image
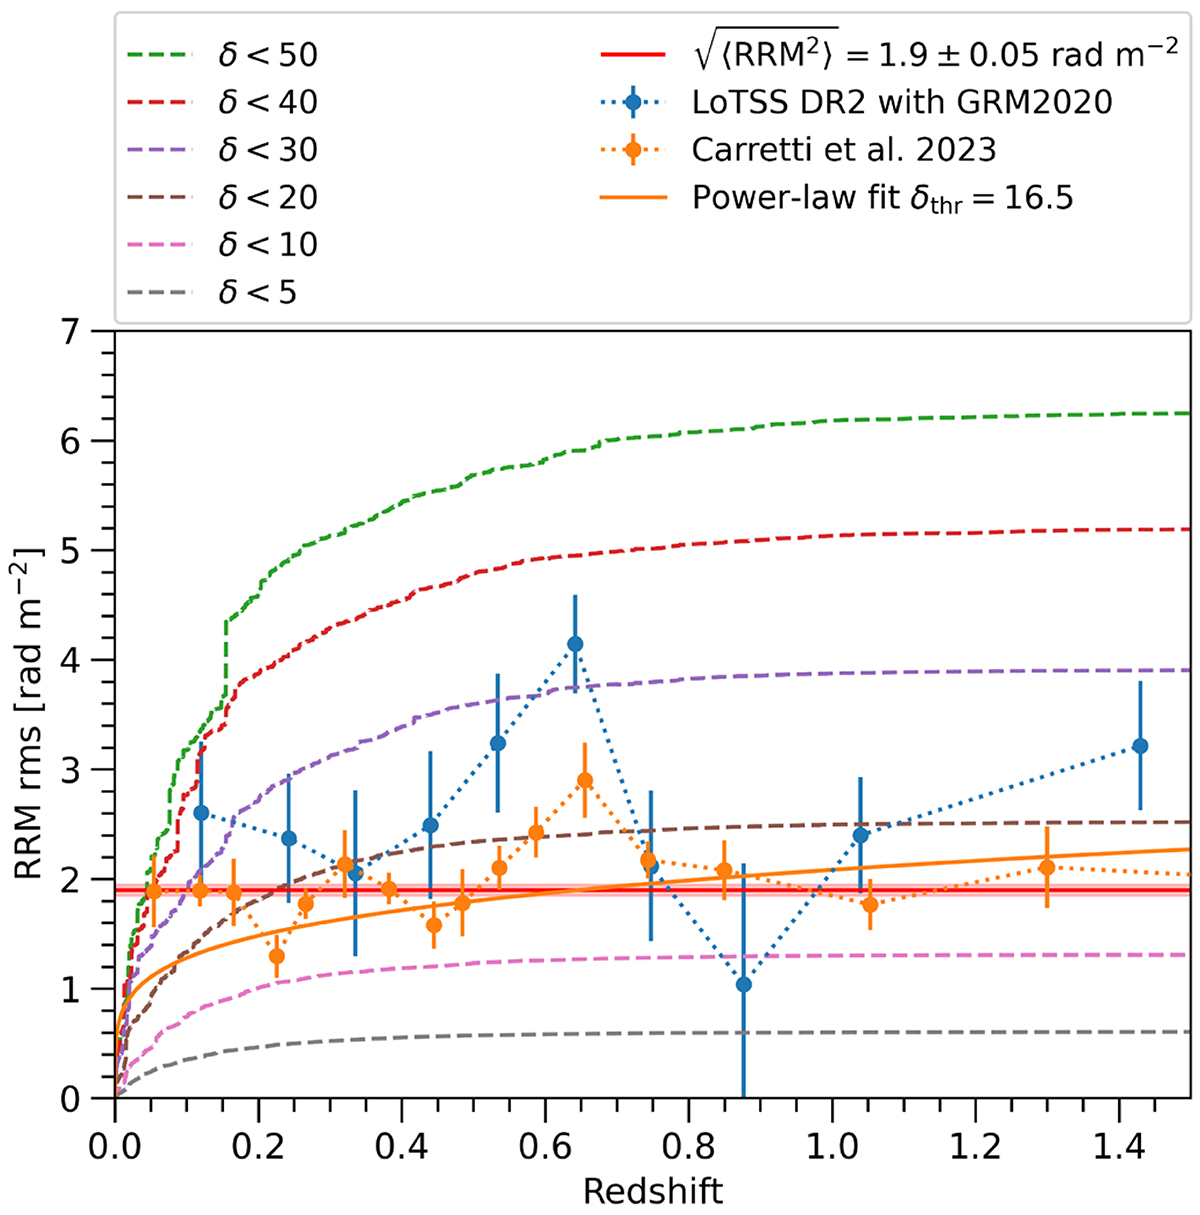
Evolution of the rms of the RM with redshift in IllustrisTNG for six different overdensities in decreasing order from top to bottom (dashed lines). The measurements of the rms of the RRM derived from the LOFAR data (Carretti et al. 2023) based on the GRM model of Hutschenreuter et al. (2022) are shown in individual redshift bins (orange data points) with a power-law fit (orange line) and a constant ![]() fit (horizontal red band). The blue data points show the rms of the RRM calculated using the GRM model of Hutschenreuter & Enßlin (2020), namely GRM2020.
fit (horizontal red band). The blue data points show the rms of the RRM calculated using the GRM model of Hutschenreuter & Enßlin (2020), namely GRM2020.
Current usage metrics show cumulative count of Article Views (full-text article views including HTML views, PDF and ePub downloads, according to the available data) and Abstracts Views on Vision4Press platform.
Data correspond to usage on the plateform after 2015. The current usage metrics is available 48-96 hours after online publication and is updated daily on week days.
Initial download of the metrics may take a while.