Fig. 8.
Download original image
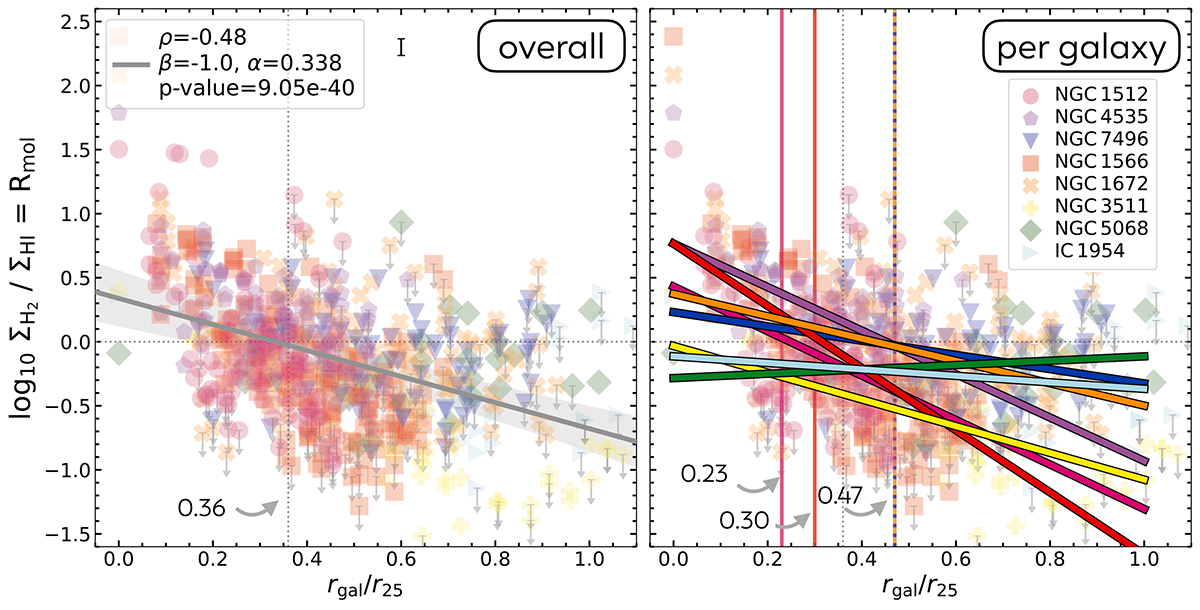
Rmol against the normalized radius rgal/r25. The region below the dotted horizontal line at Rmol = 1 can be viewed as dominated by ΣHI, and the region above that line by ΣH2. Left: grey line shows a fit for all the galaxies and it crosses the Rmol = 1 boundary at rgal ∼ 0.4 r25, which means that the atomic gas on average becomes molecular inside that radius in these eight galaxies. The grey shaded region corresponds to the 3σ confidence interval. Right: colored lines show fits for individual galaxies. We list the corresponding fit parameters in Table 4.
Current usage metrics show cumulative count of Article Views (full-text article views including HTML views, PDF and ePub downloads, according to the available data) and Abstracts Views on Vision4Press platform.
Data correspond to usage on the plateform after 2015. The current usage metrics is available 48-96 hours after online publication and is updated daily on week days.
Initial download of the metrics may take a while.