Fig. 4.
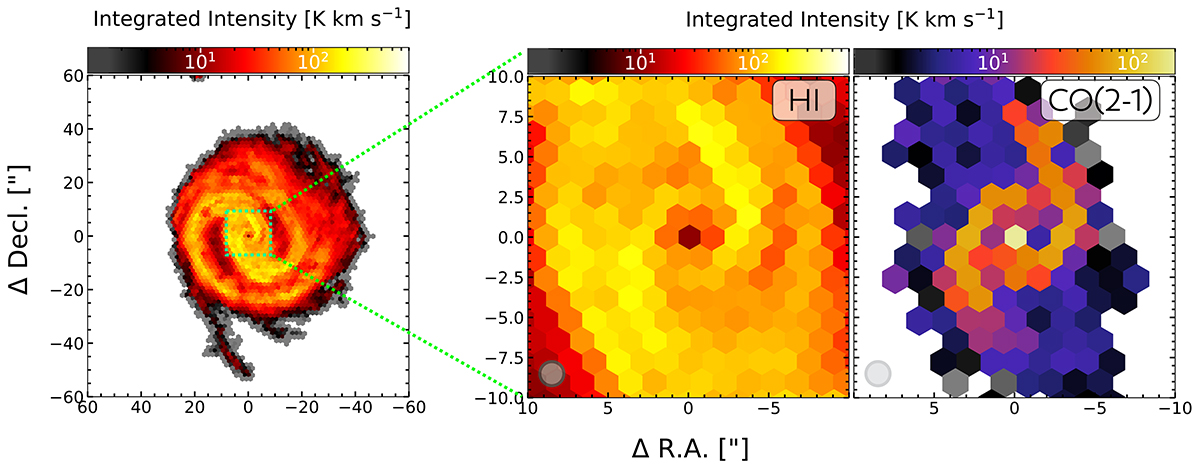
Download original image
Integrated intensity maps after hexagonal sampling. The left plot shows the overall H I disk of NGC 1566. The right two panels show the enlarged versions of the green rectangle at matched field-of-view. We show here hexagonal apertures (1.5 kpc in size) on the H I and CO(2–1) maps where the circle in the lower left corner indicates the (matched) beam size (see Table 2).
Current usage metrics show cumulative count of Article Views (full-text article views including HTML views, PDF and ePub downloads, according to the available data) and Abstracts Views on Vision4Press platform.
Data correspond to usage on the plateform after 2015. The current usage metrics is available 48-96 hours after online publication and is updated daily on week days.
Initial download of the metrics may take a while.