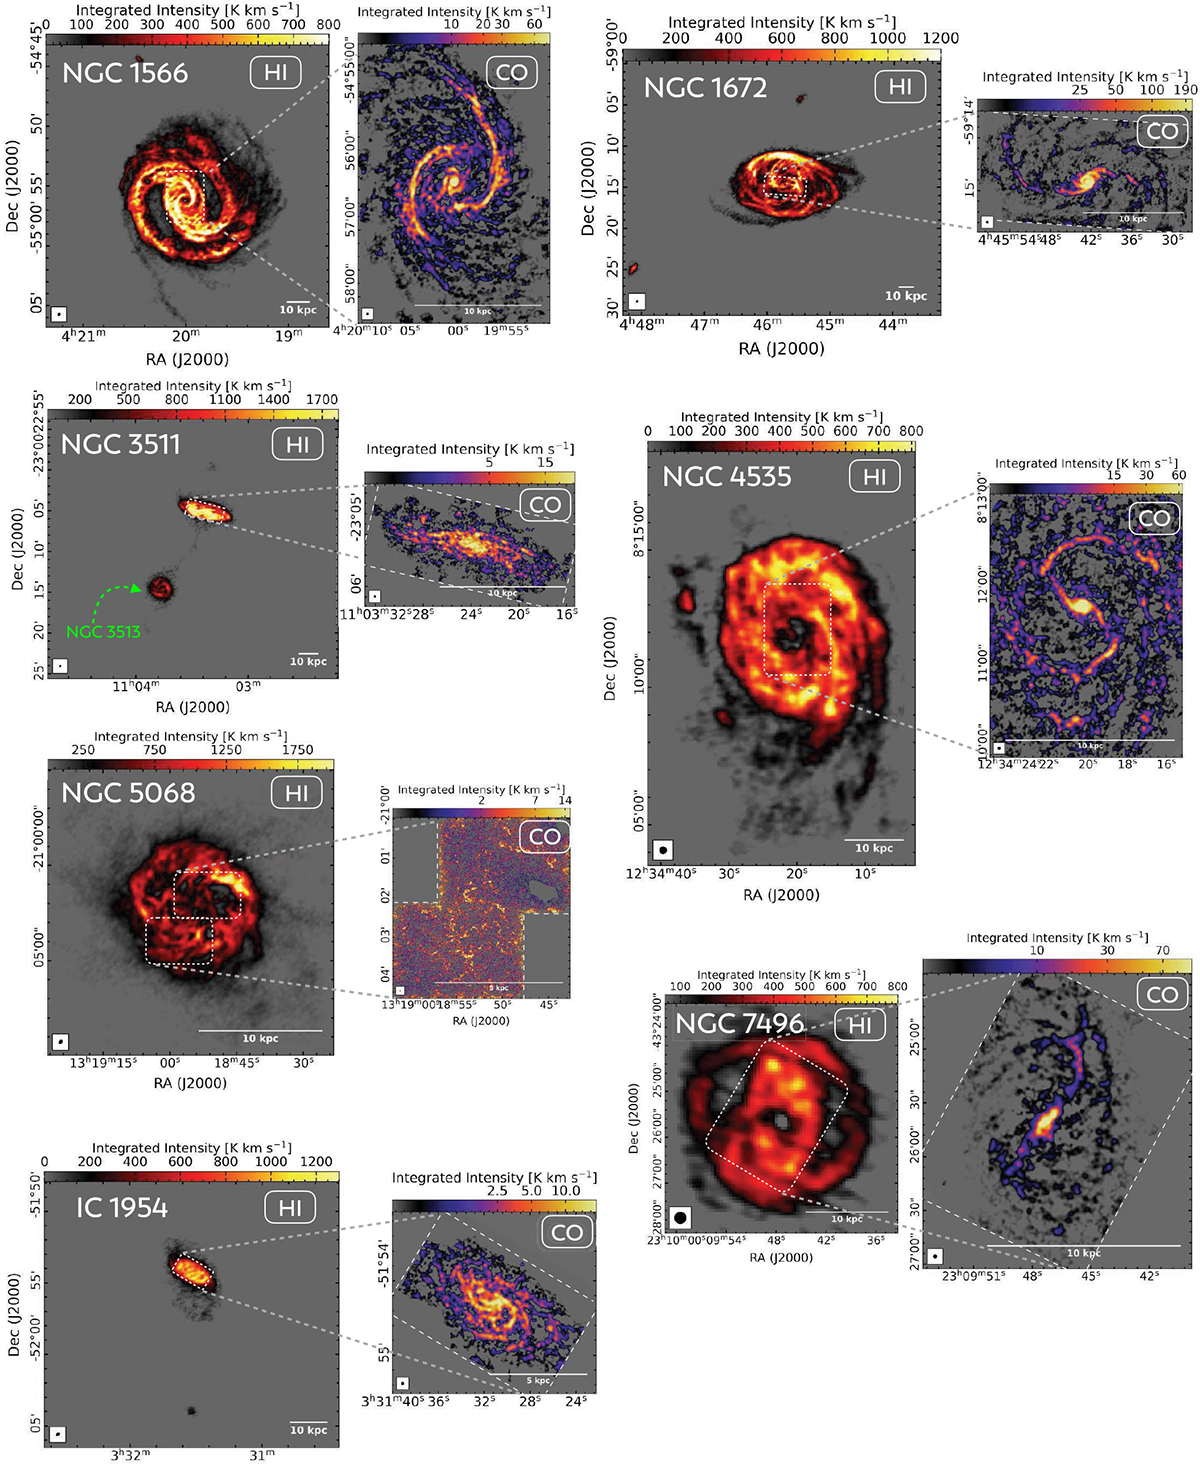
Fig. 3.
Download original image
Integrated intensity maps (moment 0) for H I emission (in red to yellow colors) and CO(2–1) (in purple to yellow colors) across the disks of our sample of eight nearby spiral galaxies (excluding NGC 1512, already shown in Figure 2). The corresponding beam sizes are visible in the bottom left corner of each map. The white dashed contours on the MeerKAT H I maps represent the field of view of the ALMA CO(2–1) observations, which we show next to each HI map. The CO maps cover ∼70 − 90% of the total CO emission (see Section 2.3).
Current usage metrics show cumulative count of Article Views (full-text article views including HTML views, PDF and ePub downloads, according to the available data) and Abstracts Views on Vision4Press platform.
Data correspond to usage on the plateform after 2015. The current usage metrics is available 48-96 hours after online publication and is updated daily on week days.
Initial download of the metrics may take a while.