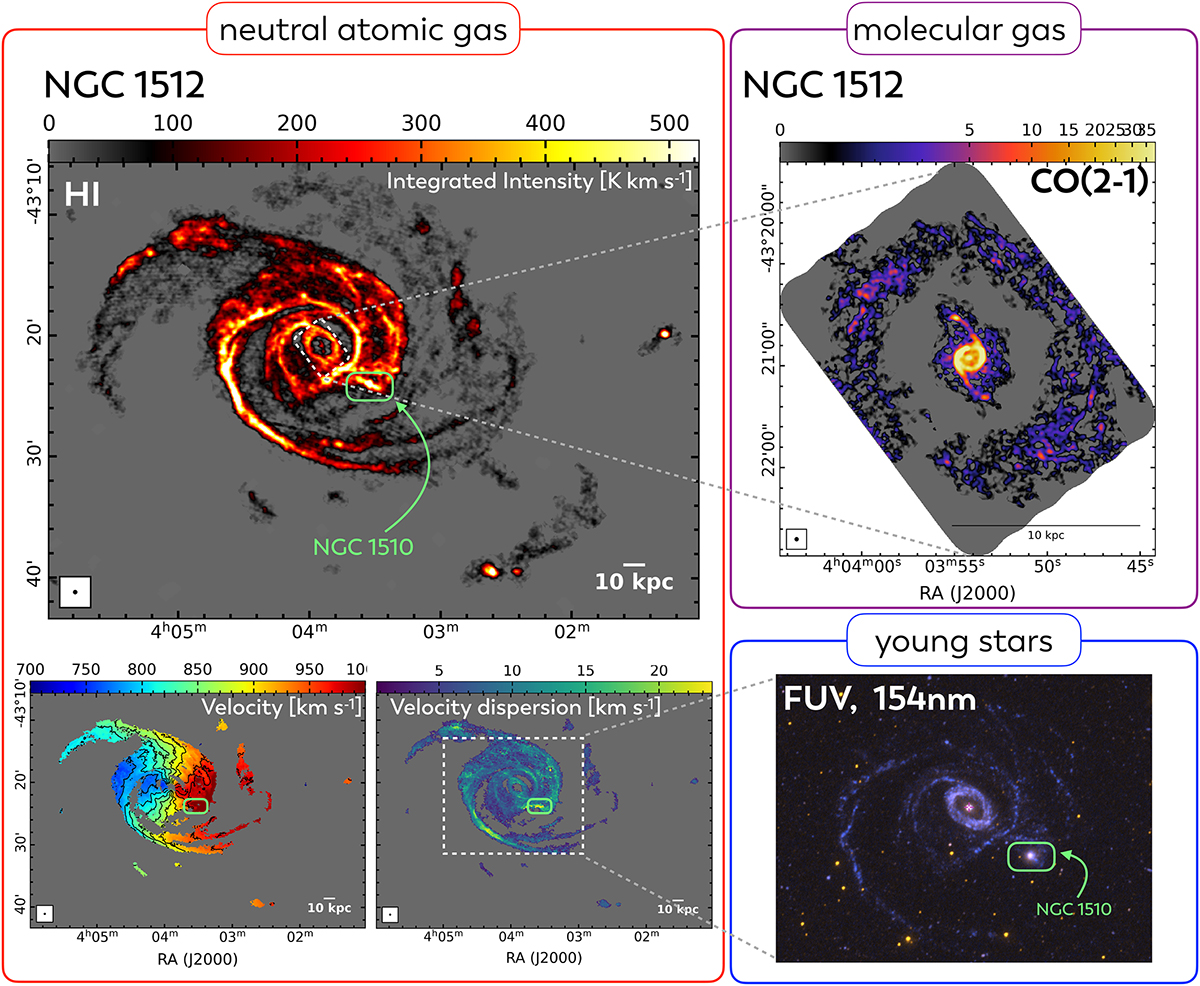
Fig. 2.
Download original image
Example of a multiwavelength view of one of our galaxies within our sample – NGC 1512. Left in red frame: MeerKAT H I observations showing on top the integrated intensity map in units of K km s−1 (moment 0), which we use in this work. Although not used in this paper, the bottom panels show the velocity field (moment 1) and the velocity dispersion (moment 2). These maps are used in Laudage et al. (2024) to analyze the neutral atomic and molecular gas kinematics in the PHANGS-MeerKAT sample. Right top in purple frame: ALMA observations of CO(2–1) from PHANGS-ALMA (Leroy et al. 2021b) showing an integrated intensity map (see Section 2.3 for CO coverage). Right bottom in blue frame: GALEX observation of FUV emission at 154 nm. The green rectangle shows the location of the interacting galaxy NGC 1510.
Current usage metrics show cumulative count of Article Views (full-text article views including HTML views, PDF and ePub downloads, according to the available data) and Abstracts Views on Vision4Press platform.
Data correspond to usage on the plateform after 2015. The current usage metrics is available 48-96 hours after online publication and is updated daily on week days.
Initial download of the metrics may take a while.