Fig. 10.
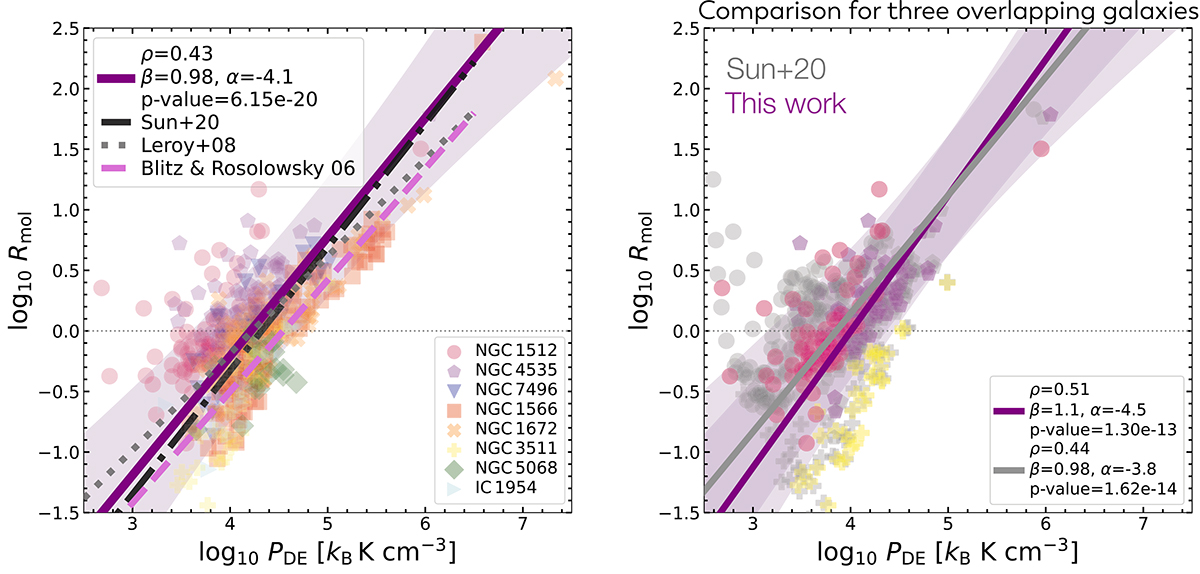
Download original image
Rmol against PDE. Left: shown here is an enlarged version of panel 5 from Figure 9, with the fit now performed over the entire sample (purple line) with the corresponding 3σ confidence interval (purple shaded region). The black, grey, and pink lines show literature fits adopted from Sun et al. (2020a), Leroy et al. (2008), and Blitz & Rosolowsky (2006), respectively. Right: Comparison between (i) Rmol and PDE estimates from Sun et al. (2020a) for three overlapping galaxies (grey markers) and (ii) our derived Rmol and PDE (colored markers). The different shapes of the markers correspond to different galaxies.
Current usage metrics show cumulative count of Article Views (full-text article views including HTML views, PDF and ePub downloads, according to the available data) and Abstracts Views on Vision4Press platform.
Data correspond to usage on the plateform after 2015. The current usage metrics is available 48-96 hours after online publication and is updated daily on week days.
Initial download of the metrics may take a while.