Fig. 1.
Download original image
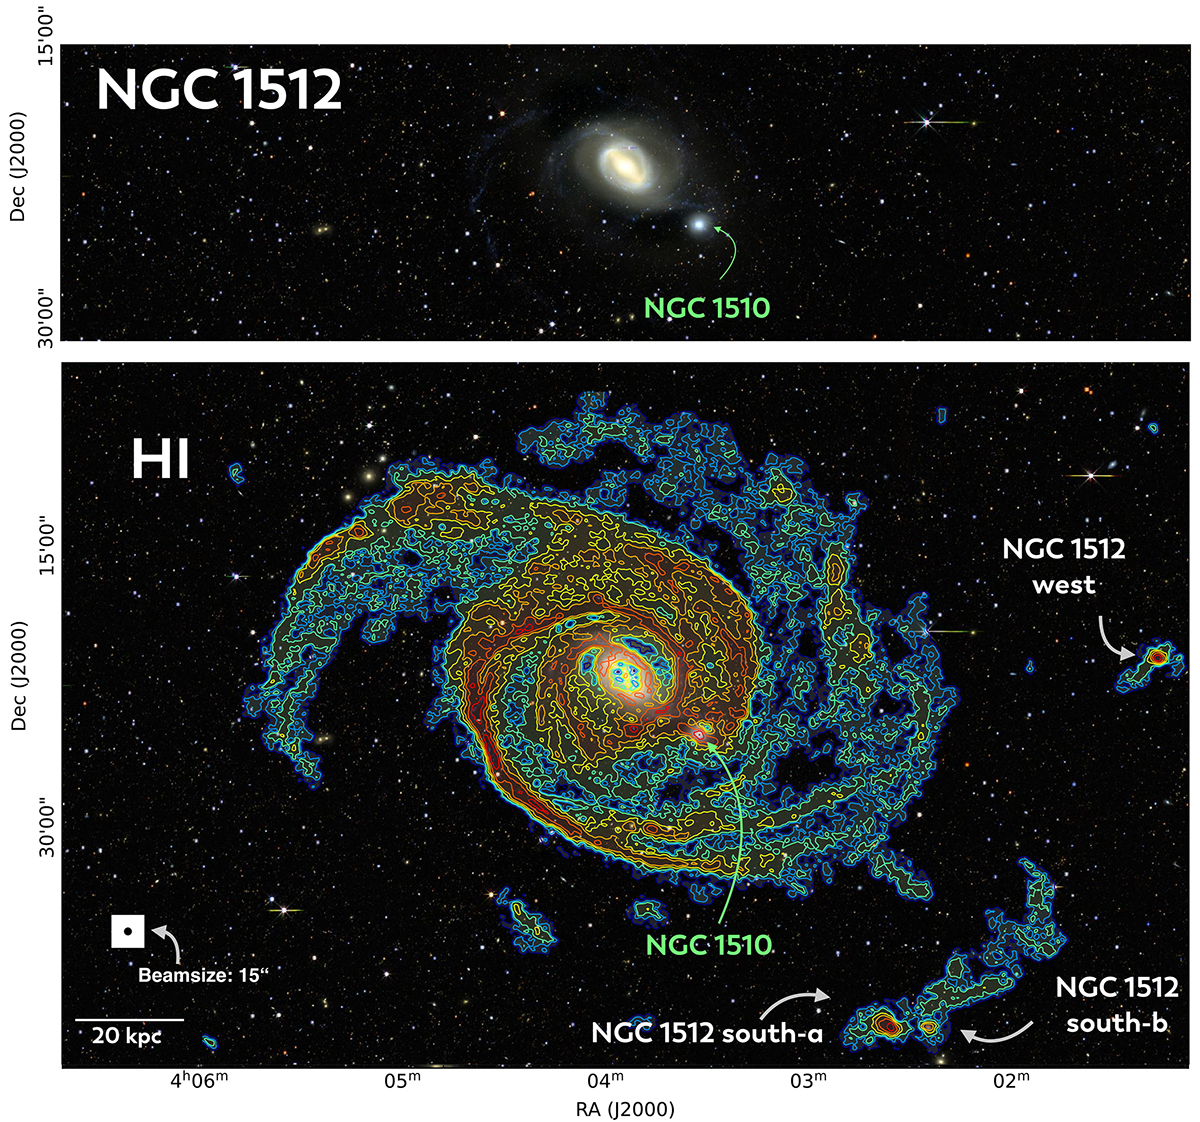
Example of the extent of the emission of H I with the new MeerKAT observations. Top: three-color optical image showing star forming spiral galaxy NGC 1512 and the low-mass dwarf companion NGC 1510 in the optical (image credits: DESI Legacy Survey). The scale bar on the lower left corner indicates 20 kpc. Bottom: same as above but overlaid with H I emission contour levels of log10 0.25, 1, 1.5, 2, 2.25, 2.5, 2.75, 3 K km s−1 together with the western and southern tidal dwarf galaxies of NGC 1512 (see Section 3 for more information).
Current usage metrics show cumulative count of Article Views (full-text article views including HTML views, PDF and ePub downloads, according to the available data) and Abstracts Views on Vision4Press platform.
Data correspond to usage on the plateform after 2015. The current usage metrics is available 48-96 hours after online publication and is updated daily on week days.
Initial download of the metrics may take a while.