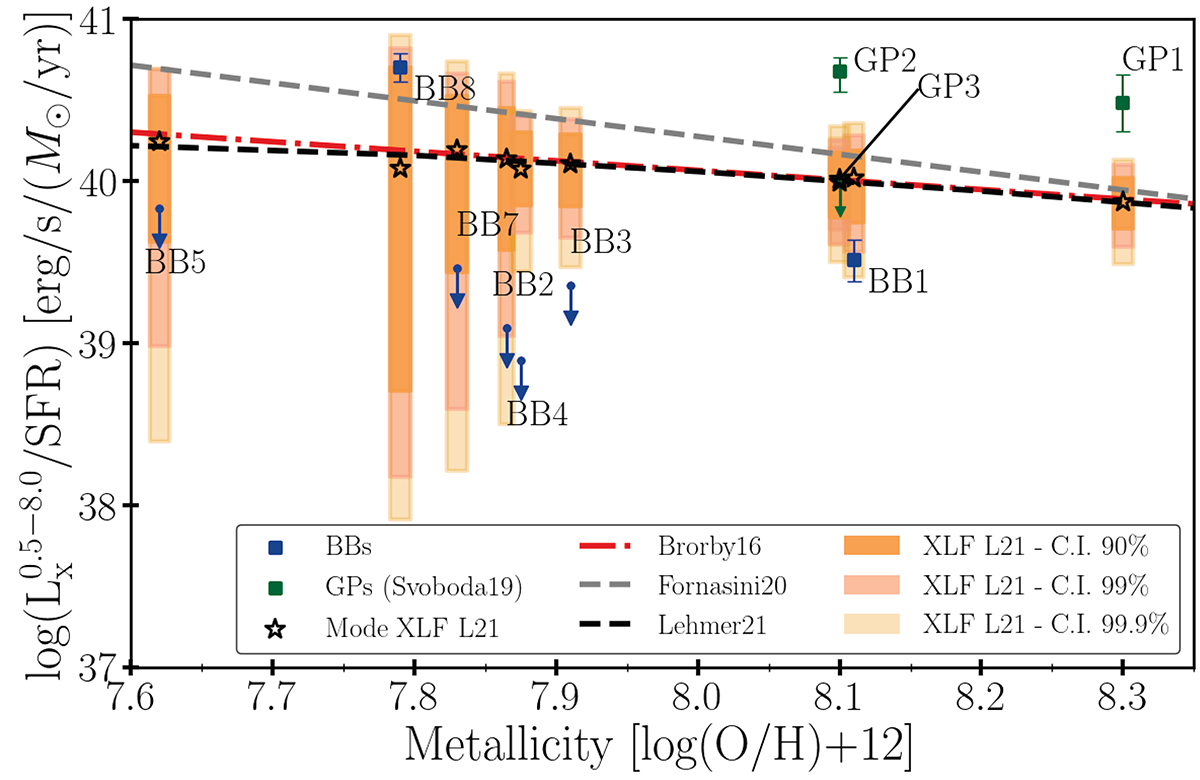
Fig. 4.
Download original image
Distribution of the total expected X-ray luminosity per SFR due to the stochastic sampling of the HMXB XLF from L21, as a function of the metallicity of each galaxy in our sample. Orange-, pink-, and goldenrod-shaded regions indicate the 90%, the 99%, and the 99.9% CI, respectively, of the expected LX/SFR distribution of each BB. Filled blue squares and down-arrows indicate the BB sample of this work. We also plot with filled green squares and down-arrows the GP sample from Svoboda et al. (2019). For comparison, we overplot with a red dot-dashed line the scaling relation from Brorby et al. (2016), with a grey dashed line the relation from Fornasini et al. (2020), and with a black dashed line the relation from Lehmer et al. (2021).
Current usage metrics show cumulative count of Article Views (full-text article views including HTML views, PDF and ePub downloads, according to the available data) and Abstracts Views on Vision4Press platform.
Data correspond to usage on the plateform after 2015. The current usage metrics is available 48-96 hours after online publication and is updated daily on week days.
Initial download of the metrics may take a while.