Fig. 3.
Download original image
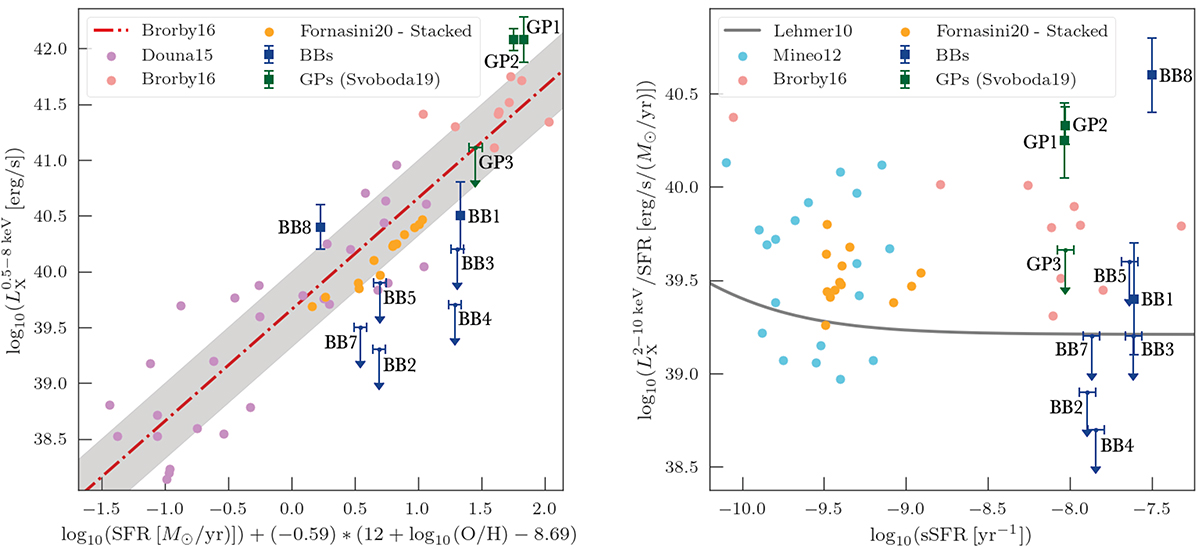
X-ray luminosity as a function of SFR, metallicity, and sSFR for the BBs and comparison samples. Left: X-ray luminosity LX as a function of SFR and metallicity for the BBs (filled blue squares and down-arrows) studied by XMM-Newton. The empirical relation by Brorby et al. (2016) is shown as a red dot-dashed line and its 1σ deviation as a grey region. Right: Our BB sample in the diagram of the X-ray luminosity over the SFR as dependent on the sSFR. The solid horizontal line represents the Lehmer et al. (2010) relation. The GP sample by Svoboda et al. (2019) (filled green squares and down-arrows) is plotted in both diagrams for comparison, along with a few other samples of Mineo et al. (2012) (filled turquoise circles only in the right plot), Douna et al. (2015) (filled purple circles only in the left plot), Brorby et al. (2016) (filled pink circles), and Fornasini et al. (2020) (filled dark yellow circles).
Current usage metrics show cumulative count of Article Views (full-text article views including HTML views, PDF and ePub downloads, according to the available data) and Abstracts Views on Vision4Press platform.
Data correspond to usage on the plateform after 2015. The current usage metrics is available 48-96 hours after online publication and is updated daily on week days.
Initial download of the metrics may take a while.