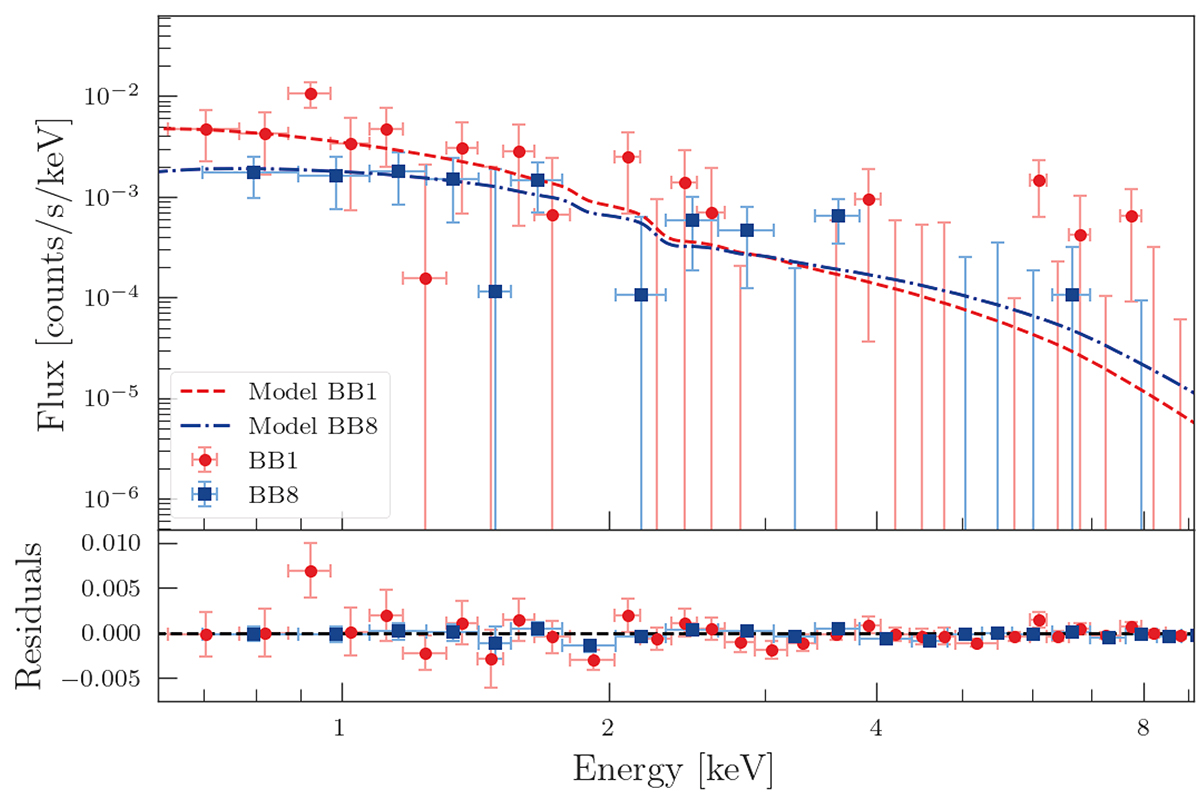
Fig. 2.
Download original image
X-ray XMM-Newton EPIC combined folded spectra of BB1 (filled red circles) and BB8 (filled blue squares) overplotted with their respective best-fit models (absorbed power-law) in dashed red for BB1 and dot-dashed blue for BB8. The residuals after the model subtraction are plotted in the bottom panel. The plotted data are binned to 20 counts per bin using the setplotrebin tool in XSPEC for plotting purposes only (the fitting was done with data only binned to have at least one count per bin).
Current usage metrics show cumulative count of Article Views (full-text article views including HTML views, PDF and ePub downloads, according to the available data) and Abstracts Views on Vision4Press platform.
Data correspond to usage on the plateform after 2015. The current usage metrics is available 48-96 hours after online publication and is updated daily on week days.
Initial download of the metrics may take a while.