Fig. 1.
Download original image
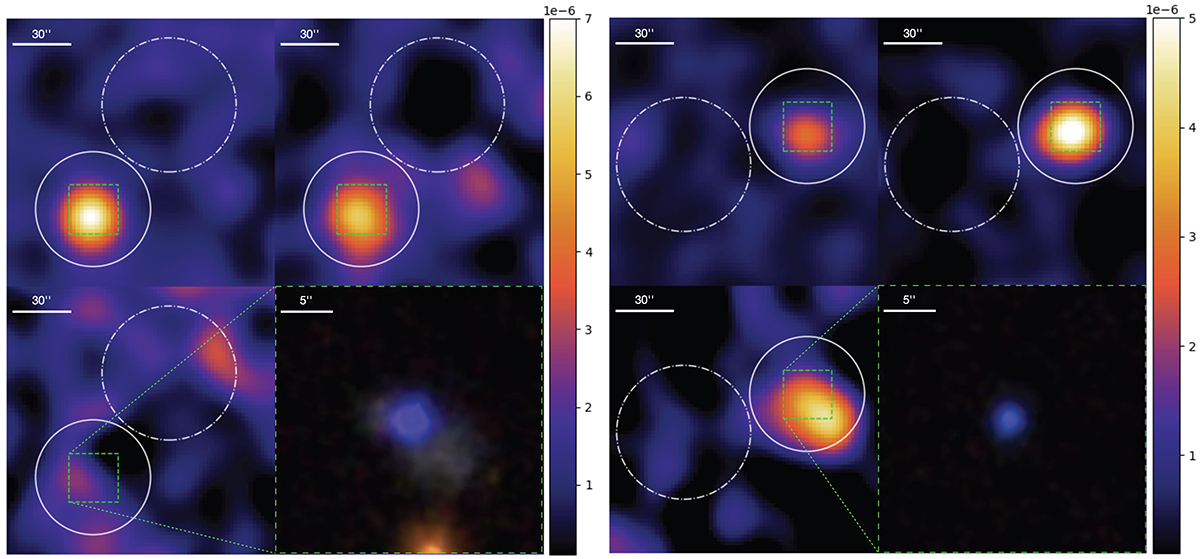
X-ray vignetting-corrected background-subtracted images for BB1 (left) and BB8 (right) in the three used energy bands, 0.5–1 keV, 1–2 keV, and 2–10 keV (from top left to bottom left), and the SDSS optical images (bottom right). The source extraction regions (solid white open circles) and background regions (dot-dashed white open circles) are denoted in the figures (see the appendix for details of the extraction regions). The dashed green open rectangles, present in each X-ray image, indicate the regions corresponding to the SDSS images. The X-ray images are given in linear scale using the minima and maxima of the image cutouts. The colour scale denotes the pixel intensity, i.e. the scaled and weighted count rate per pixel. The SDSS images are shown at a different size scale than the X-ray images since a larger field of view would not provide adequate detail of the galaxies.
Current usage metrics show cumulative count of Article Views (full-text article views including HTML views, PDF and ePub downloads, according to the available data) and Abstracts Views on Vision4Press platform.
Data correspond to usage on the plateform after 2015. The current usage metrics is available 48-96 hours after online publication and is updated daily on week days.
Initial download of the metrics may take a while.