Fig. 1
Download original image
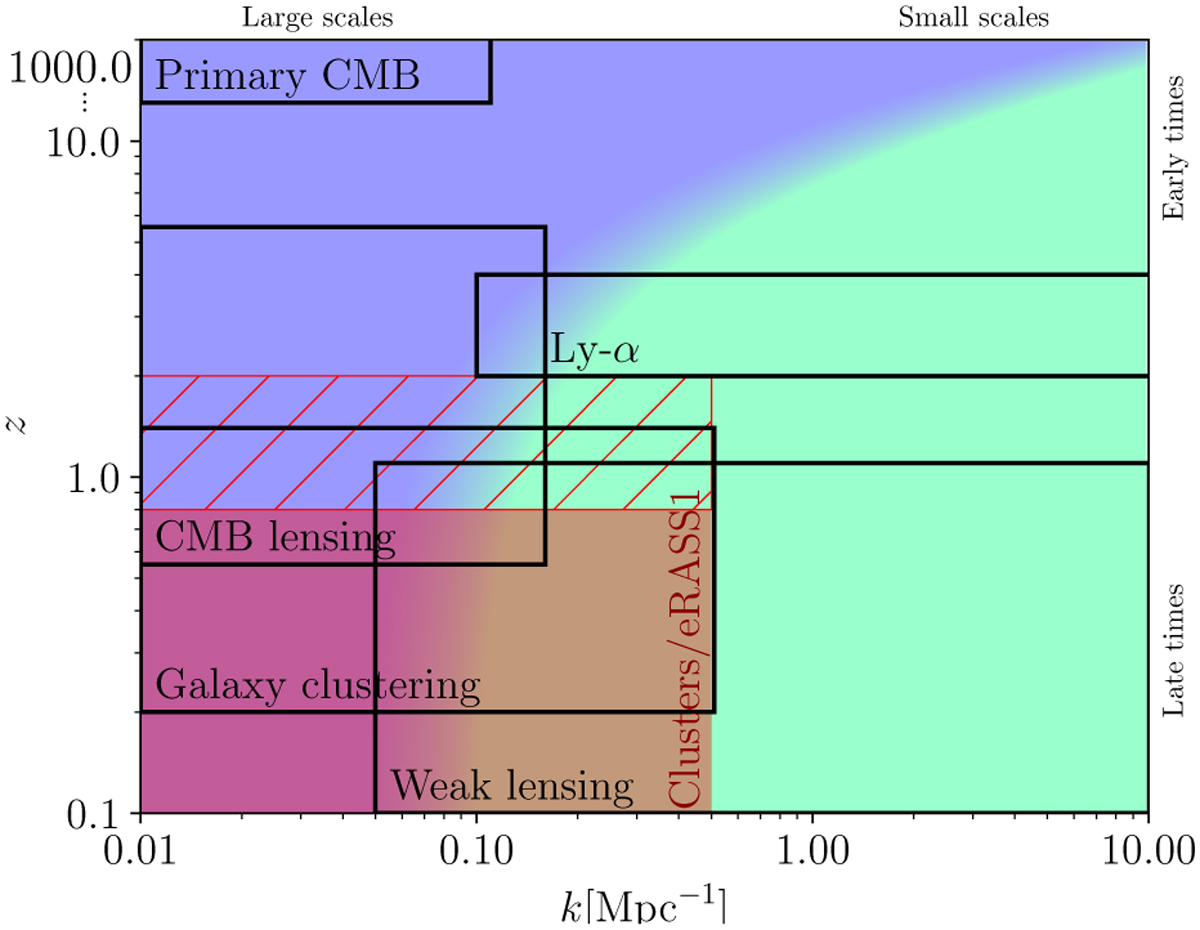
Estimation of the scale and redshift sensitivity of the different cosmological probes, adapted from Preston et al. (2023). The background colors, from blue to green, represent the transition from the linear to the nonlinear regime. We represent cluster abundance with the red rectangle. The cosmology sample of eRASS1 spans the redshift range 0.1 < z < 0.8, as is represented by the solid red rectangle. Future data releases and experiments will increase the upper limit of this interval to the hatched red rectangle. Cluster abundance experiments thus probe a specific regime at LSSs and the nearby Universe, offering a complementary window on structure formation. The constraints from cluster clustering (Seppi et al. 2024) are omitted here. Additionally, the X-ray power spectrum might probe smaller scales.
Current usage metrics show cumulative count of Article Views (full-text article views including HTML views, PDF and ePub downloads, according to the available data) and Abstracts Views on Vision4Press platform.
Data correspond to usage on the plateform after 2015. The current usage metrics is available 48-96 hours after online publication and is updated daily on week days.
Initial download of the metrics may take a while.