Fig. 7.
Download original image
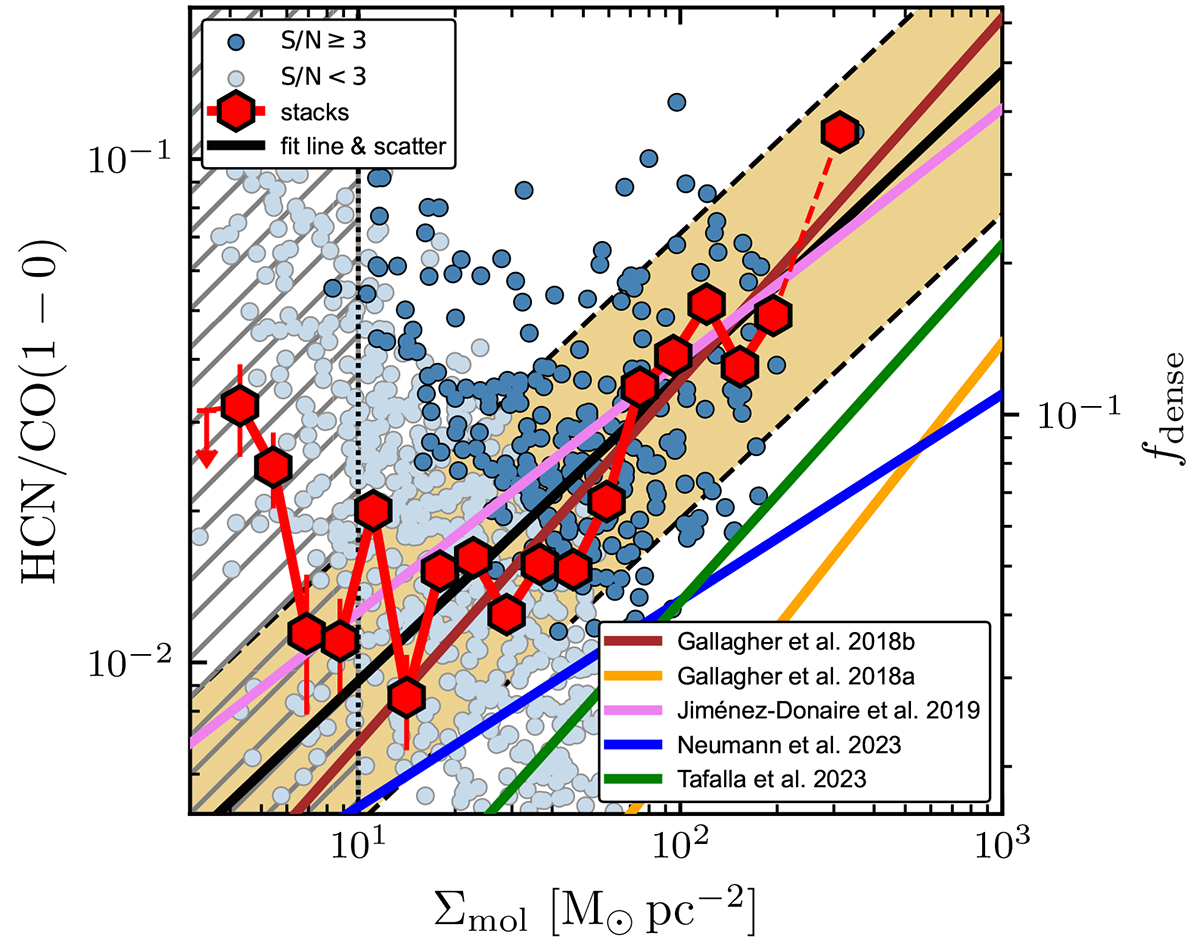
Dense gas spectroscopic ratios versus radius in different morphological environments. Similar to Fig. 6 (left panels), but separately for each environment (compare with right map in Fig. 3). The lighter markers denote low-significant (S/N < 3) data. The grey solid line shows the trend of the spectral stacks as in Fig. 6 (red markers). The coloured lines indicate the stacked measurements of the respective environments taken over all CO detected data (i.e. including HCN non-detections) in the respective environment.
Current usage metrics show cumulative count of Article Views (full-text article views including HTML views, PDF and ePub downloads, according to the available data) and Abstracts Views on Vision4Press platform.
Data correspond to usage on the plateform after 2015. The current usage metrics is available 48-96 hours after online publication and is updated daily on week days.
Initial download of the metrics may take a while.