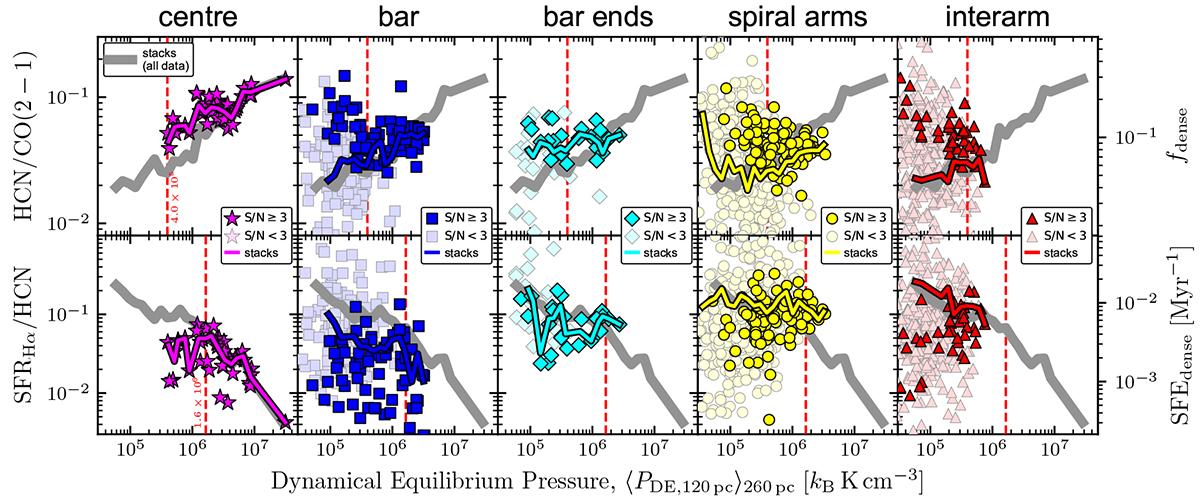
Fig. 6.
Download original image
Dense gas spectroscopic ratios as a function of galactocentric radius and environmental pressure. Top: HCN/CO, a proxy of the dense gas fraction, fdense, as a function of rgal and ⟨PDE⟩. Bottom: SFR/HCN, a proxy of the dense gas star formation efficiency, SFEdense, against rgal and ⟨PDE⟩. Significant data, that is, S/N ≥ 3, are shown as blue markers. Low significance data (S/N < 3) are shown in light blue. The red hexagon markers denote significant spectral stacks taken over all data, with the bars showing the uncertainties obtained from the stacked spectra. The red arrows indicate 3σ upper limits of the HCN stacks resulting in HCN/CO upper limits and SFR/HCN lower limits. In the left panels, the hatched region (rgal > 9.17 kpc) indicates the range where the map is not complete (compare with Fig. 3). The vertical red dashed lines indicate the x-axis values separating two regions with different linear regression behaviour based on the MARS model. The dashed black lines indicate the best-fit lines resulting from the MARS model (Table 4). The gold-shaded area shows the 3-sigma scatter of the detected sightlines about the fit line.
Current usage metrics show cumulative count of Article Views (full-text article views including HTML views, PDF and ePub downloads, according to the available data) and Abstracts Views on Vision4Press platform.
Data correspond to usage on the plateform after 2015. The current usage metrics is available 48-96 hours after online publication and is updated daily on week days.
Initial download of the metrics may take a while.