Fig. 5.
Download original image
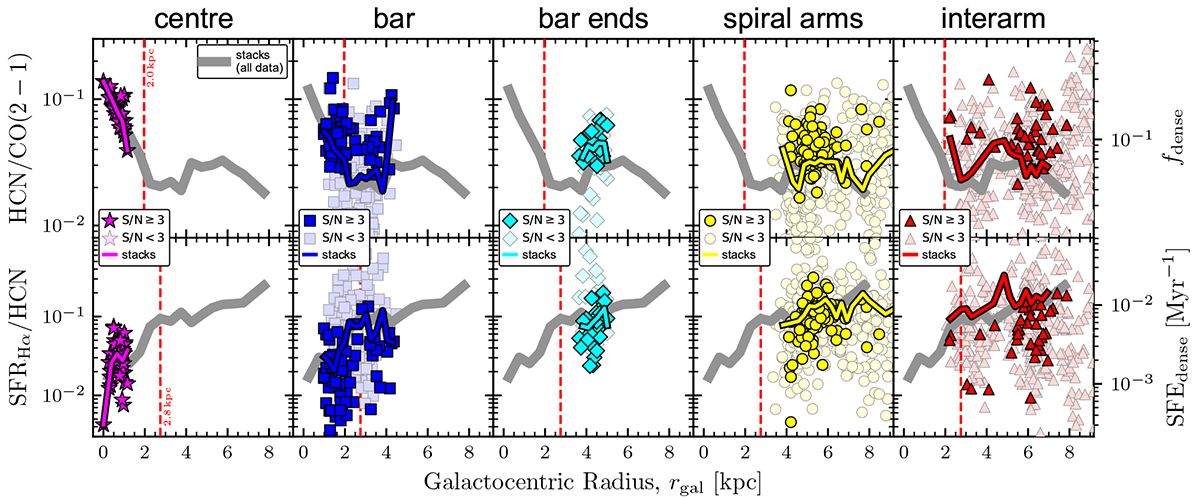
Violin plots of dense gas spectroscopic ratios separated by environmental regions. Left: HCN/CO line ratio, a proxy of the dense gas fraction, fdense. Right: SFRHα/HCN, a proxy of the dense gas star formation efficiency, SFEdense, in units of ![]() . The darker coloured violin areas are created from significant data (S/N ≥ 3). The lighter coloured areas represent the distribution of all S/N, this means including non-detections. The black bar indicates the 16th to 84th percentile range of the significant data and the coloured vertical line within the bars denotes the median. Circles show the means (sum of the ratio’s numerator divided by the sum of the ratio’s denominator) of the significant data. Squares show the stacked means, which take into account all data detected in CO within the respective environment. The values are listed in Table 3.
. The darker coloured violin areas are created from significant data (S/N ≥ 3). The lighter coloured areas represent the distribution of all S/N, this means including non-detections. The black bar indicates the 16th to 84th percentile range of the significant data and the coloured vertical line within the bars denotes the median. Circles show the means (sum of the ratio’s numerator divided by the sum of the ratio’s denominator) of the significant data. Squares show the stacked means, which take into account all data detected in CO within the respective environment. The values are listed in Table 3.
Current usage metrics show cumulative count of Article Views (full-text article views including HTML views, PDF and ePub downloads, according to the available data) and Abstracts Views on Vision4Press platform.
Data correspond to usage on the plateform after 2015. The current usage metrics is available 48-96 hours after online publication and is updated daily on week days.
Initial download of the metrics may take a while.