Fig. 3.

Download original image
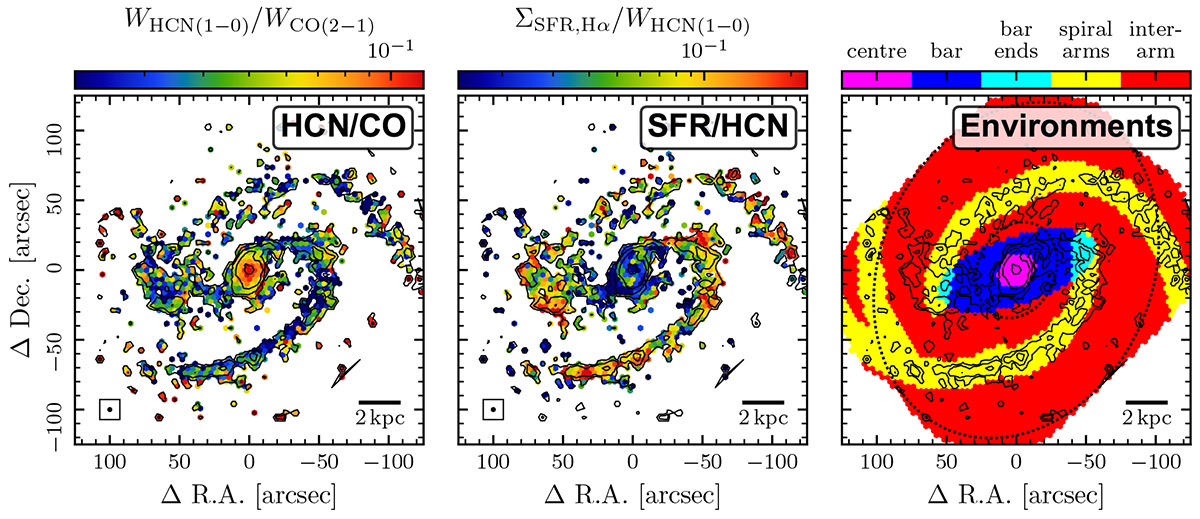
NGC 4321 maps sampled at beam size. Left: HCN/CO line ratio map, as a proxy of the dense gas fraction (fdense). The CO(2–1) data are taken from the PHANGS-ALMA survey (Leroy et al. 2021b). Middle: SFR surface density-to-HCN line intensity ratio, as a proxy of the dense gas star formation efficiency (SFEdense). The SFR surface densities are obtained from the Balmer decrement-corrected Hα flux computed from PHANGS-MUSE data (Emsellem et al. 2022; Belfiore et al. 2023). Black contours show HCN S/N levels of 3, 10, 30, 100, and 300, in each of the panels. In the left and middle plots, only pixels above 1-sigma are shown. The colour scale goes from the 10th to the 95th percentile of pixels above 1-sigma noise level. Right: Environmental region mask from Querejeta et al. (2021), which is created based on the Spitzer 3.6 μm maps tracing the stellar mass content. Here, we select the regions centre, bar, bar ends, spiral arms and interarm, where the interarm includes the interbar region. The dotted ellipses show loci of constant galactocentric radius (rgal), drawn at rgal = 2.6 kpc and rgal = 9.17 kpc, where the latter indicates the largest radius completely covered by the HCN field of view.
Current usage metrics show cumulative count of Article Views (full-text article views including HTML views, PDF and ePub downloads, according to the available data) and Abstracts Views on Vision4Press platform.
Data correspond to usage on the plateform after 2015. The current usage metrics is available 48-96 hours after online publication and is updated daily on week days.
Initial download of the metrics may take a while.


