Fig. 2.
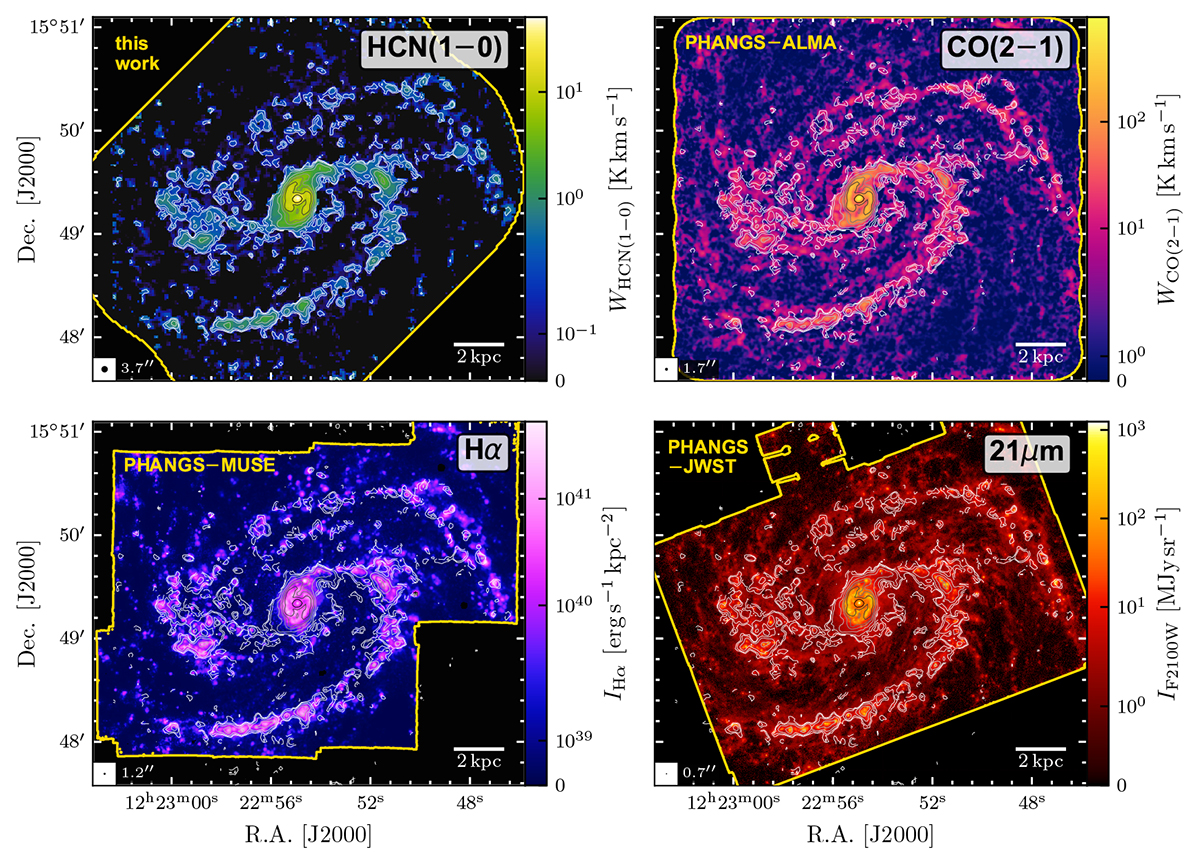
Download original image
NGC 4321 data used in this study, each at the native resolution of the respective observations indicated in the bottom left of each panel. Top left: HCN(1–0) moment-zero map presented in this work. Top right: CO(2–1) moment-zero map from PHANGS–ALMA (Leroy et al. 2021b). Bottom left: Extinction-corrected Hα flux density from PHANGS–MUSE (Emsellem et al. 2022). Bottom right: 21 μm flux density from MIRI-F2100W (PHANGS–JWST; Lee et al. 2023). In each panel, white-to-black-gradient contours show HCN moment-zero signal-to-noise ratio levels of (2, 3, 5, 10, 20, 30, 50, 100) as in Fig. 1. The yellow-coloured outline shows the FOV of the respective observations.
Current usage metrics show cumulative count of Article Views (full-text article views including HTML views, PDF and ePub downloads, according to the available data) and Abstracts Views on Vision4Press platform.
Data correspond to usage on the plateform after 2015. The current usage metrics is available 48-96 hours after online publication and is updated daily on week days.
Initial download of the metrics may take a while.