Fig. D.1.
Download original image
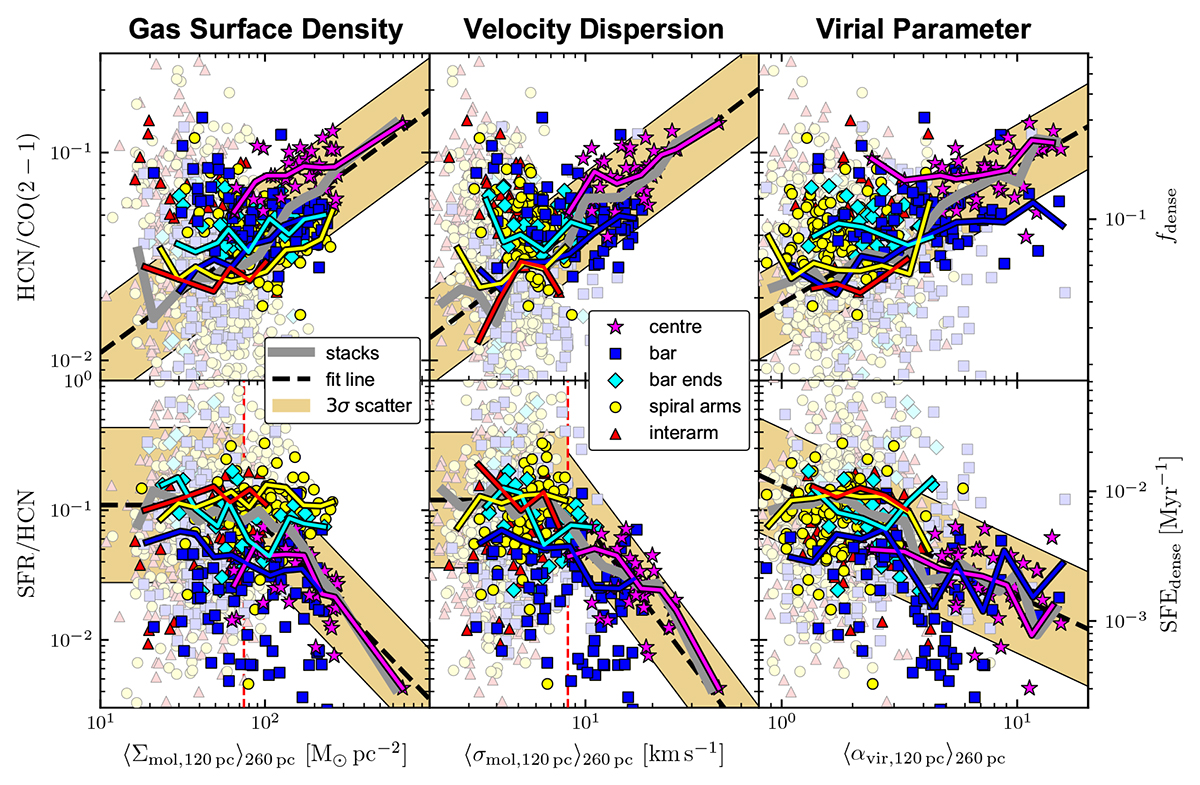
HCN spectroscopic ratios against molecular cloud properties. Top: HCN/CO and (bottom) SFR/HCN measured at 260 pc scale versus cloud-scale molecular gas properties inferred from 120 pc scale CO(2–1) observations. Panels from left to right show molecular cloud surface density (Σmol), velocity dispersion (σmol) and virial parameter (αvir) on the x-axis, obtained from PHANGS–ALMA as described in Sect. D.1. Similarly to Fig. 7 and 8, markers indicate the respective environments and line fits as well as linear regression regimes are determined via MARS. The obtained thresholds are ![]() for SFR/HCN versus Σmol and σmol = 8.3 km s−1 for SFR/HCN versus σmol. The linear regression parameters are listed in Tab. D.1.
for SFR/HCN versus Σmol and σmol = 8.3 km s−1 for SFR/HCN versus σmol. The linear regression parameters are listed in Tab. D.1.
Current usage metrics show cumulative count of Article Views (full-text article views including HTML views, PDF and ePub downloads, according to the available data) and Abstracts Views on Vision4Press platform.
Data correspond to usage on the plateform after 2015. The current usage metrics is available 48-96 hours after online publication and is updated daily on week days.
Initial download of the metrics may take a while.