Fig. C.1.
Download original image
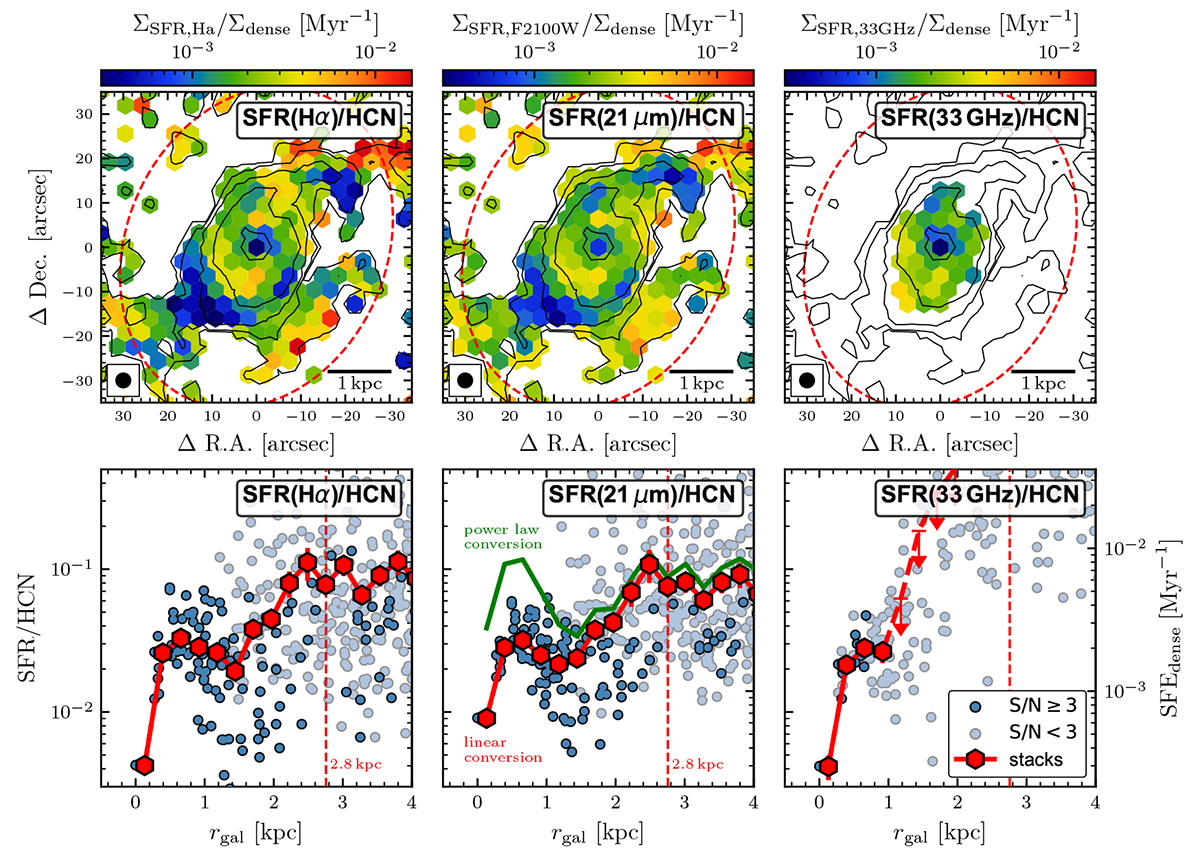
Comparison of SFR tracer in dense gas scaling relations in the inner 4 kpc. Top: SFR/HCN, tracing dense gas star formation efficiency, using three different SFR tracer from left to right, Hα from MUSE, 21 μm from JWST and 33 GHz from VLA. Contours show HCN intensities as in Fig. 3. The dotted ellipse denotes rgal = 2.75 kpc. Bottom: SFR/HCN, matching the respective above panels, against galactocentric radius, rgal. Blue points indicate detected (S/N ≥ 3) and light blue points denote non-significant (S/N < 3) data. The red hexagon markers show the spectral stacks taken over all data within the bin. In the middle panel, we show the data obtained from the linear 21 μm-to-SFR conversion (Equ. (C.1)) and additionally indicate the mean trend inferred from a power law conversion, that is, SFR ∝ L(F2100W)1.3 (Leroy et al. 2023).
Current usage metrics show cumulative count of Article Views (full-text article views including HTML views, PDF and ePub downloads, according to the available data) and Abstracts Views on Vision4Press platform.
Data correspond to usage on the plateform after 2015. The current usage metrics is available 48-96 hours after online publication and is updated daily on week days.
Initial download of the metrics may take a while.