Fig. A.1.
Download original image
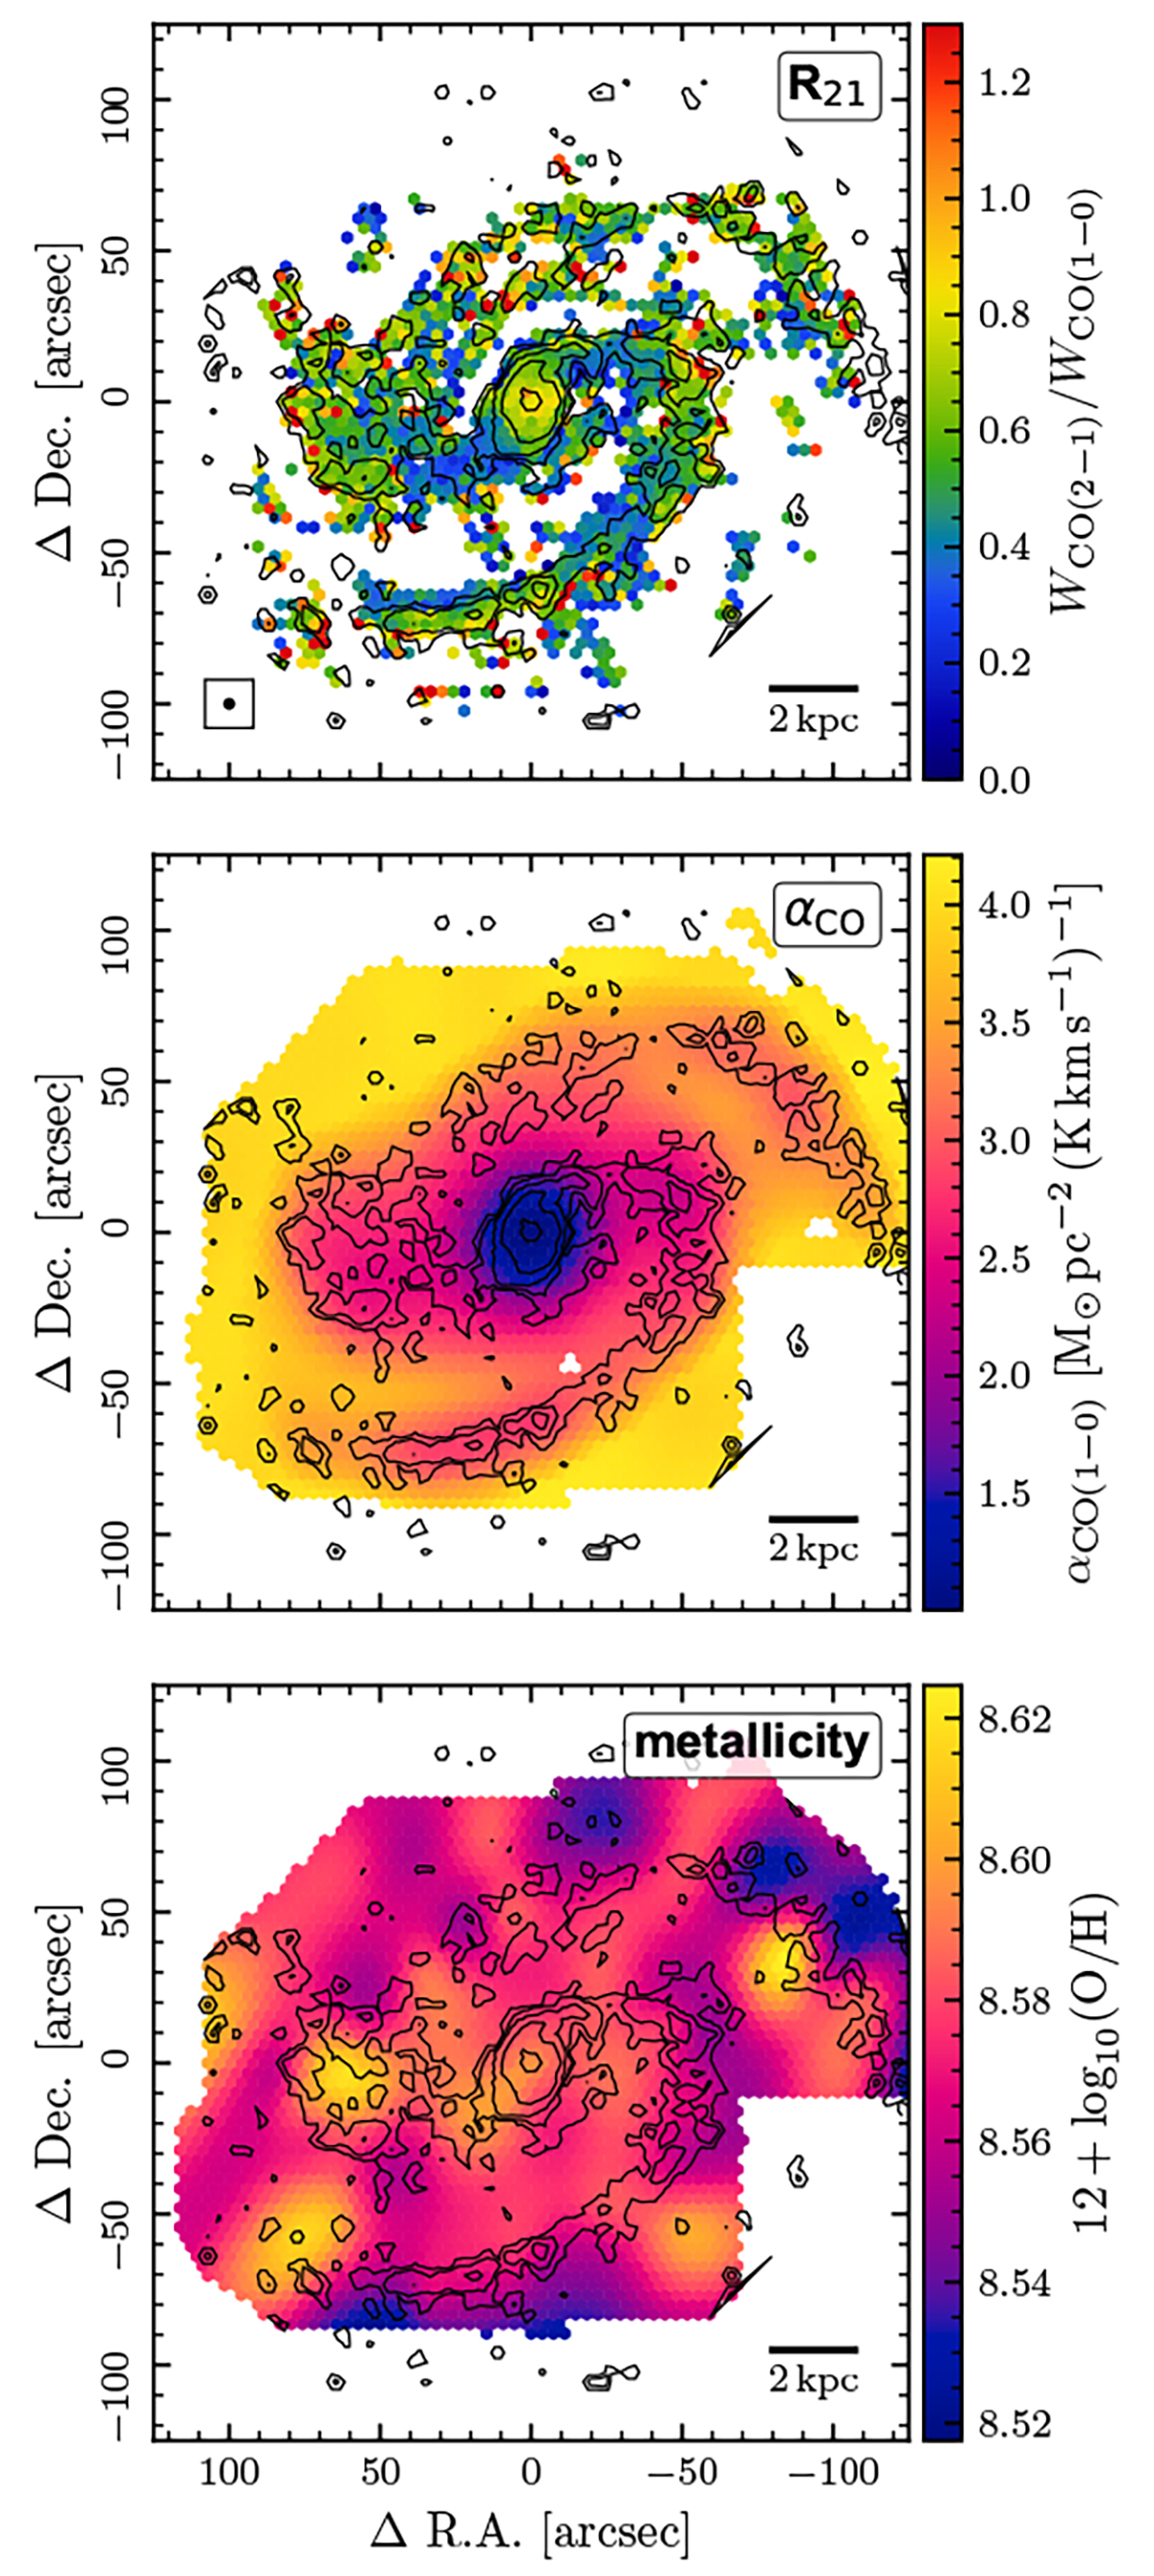
Conversion factor maps. Top: CO(2–1)-to-CO(1–0) line ratio (R21) map computed from CO(2–1) observations (PHANGS–ALMA) and CO(1–0) observations (ALMA science verification program) at a common 4″resolution. Middle: CO-to-H2 conversion factor (αCO) following the prescription from Bolatto et al. (2013) (Equ. A.2) using metallicities (bottom panel) from PHANGS–MUSE optical recombination lines observations (Williams et al. 2022).
Current usage metrics show cumulative count of Article Views (full-text article views including HTML views, PDF and ePub downloads, according to the available data) and Abstracts Views on Vision4Press platform.
Data correspond to usage on the plateform after 2015. The current usage metrics is available 48-96 hours after online publication and is updated daily on week days.
Initial download of the metrics may take a while.