Fig. 9.
Download original image
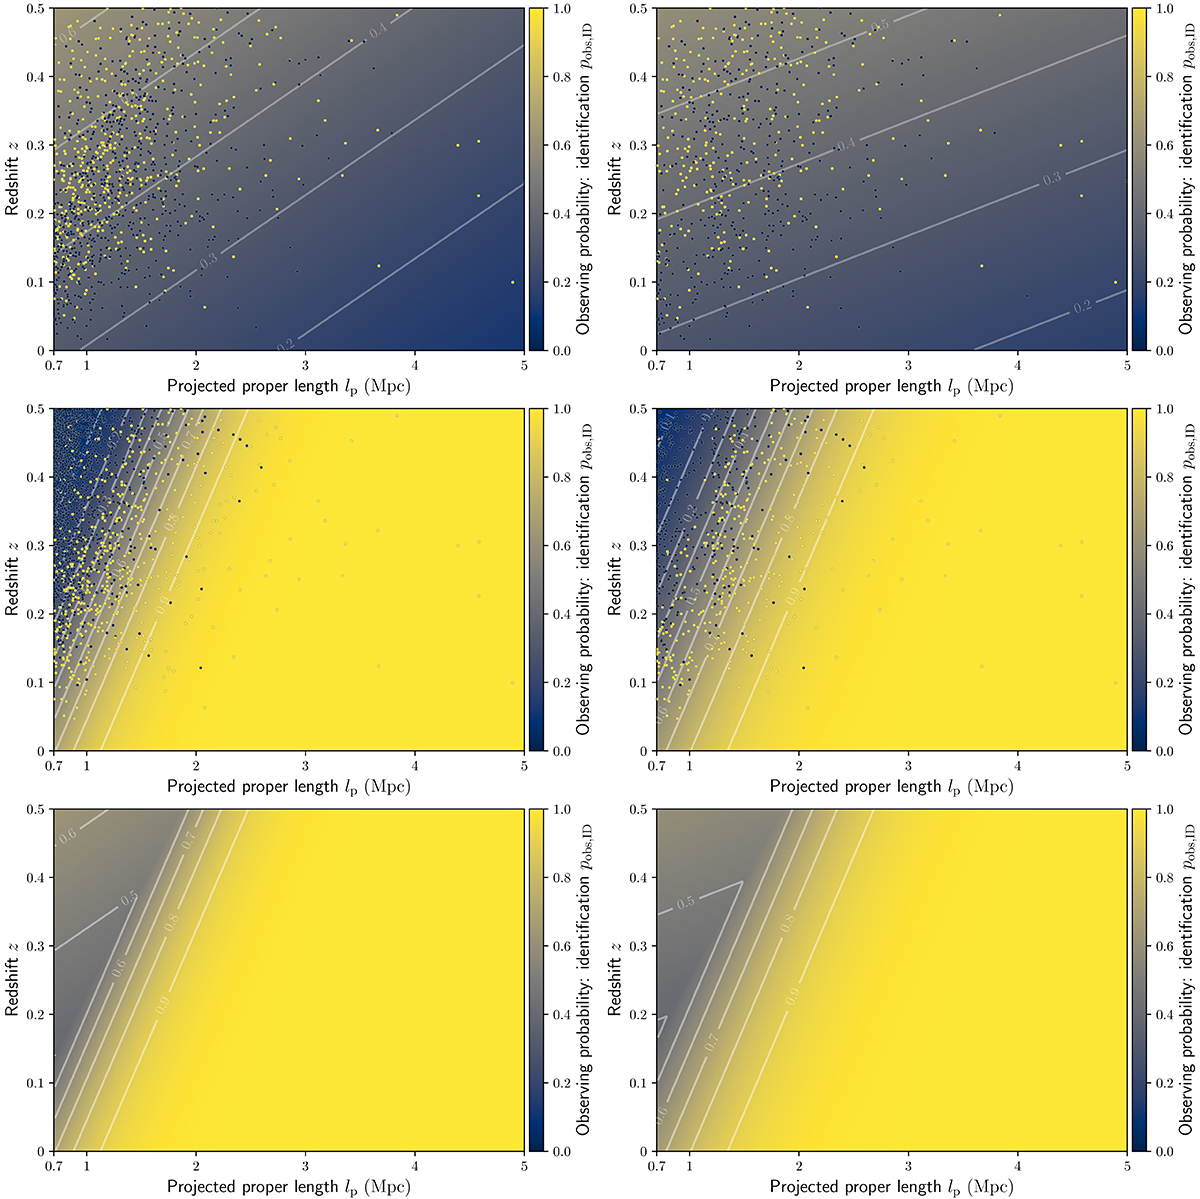
Overview of our determination of the probability to identify giants in the LoTSS DR2 with above-noise surface brightnesses, as a function of projected length and redshift – through Radio Galaxy Zoo: LOFAR and our machine learning pipeline (top row), through the search of Oei et al. (2023a, middle row), and through these methods in unison (bottom row). Each of the upper four panels shows a binary logistic regression following the theory of Sect. 2.4.2 and the practical considerations of Sect. 4.9.1. The left column shows results from all available data, whilst the right column shows results from rebalanced data. In our Bayesian inference, we used the latter results.
Current usage metrics show cumulative count of Article Views (full-text article views including HTML views, PDF and ePub downloads, according to the available data) and Abstracts Views on Vision4Press platform.
Data correspond to usage on the plateform after 2015. The current usage metrics is available 48-96 hours after online publication and is updated daily on week days.
Initial download of the metrics may take a while.