Open Access
Fig. 8.
Download original image
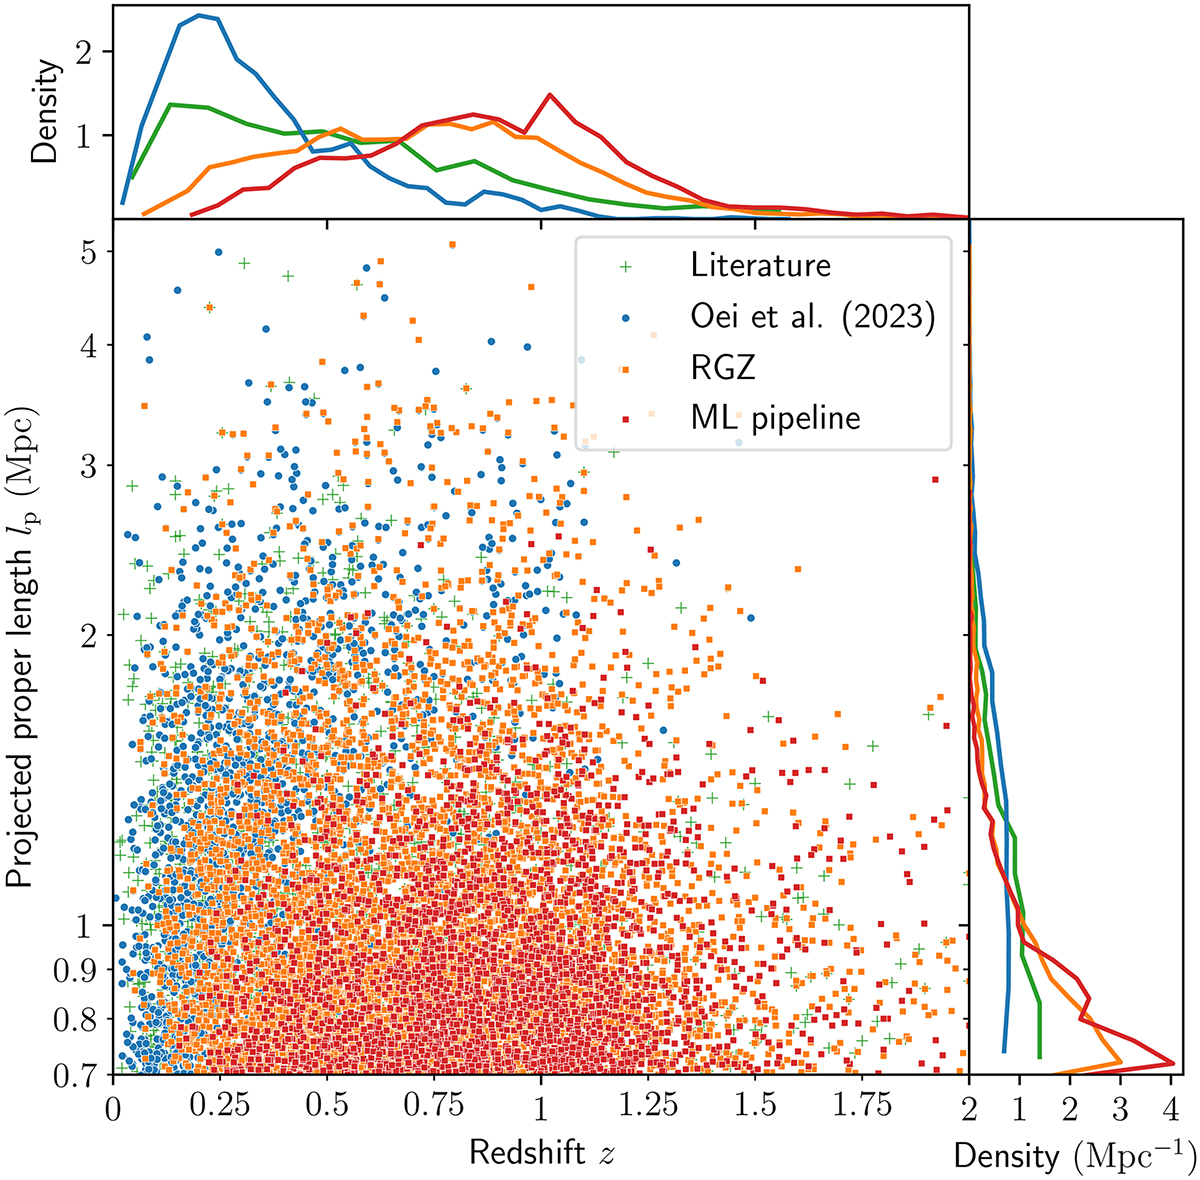
Our sample of RGZ giants (orange squares) and ML pipeline giants (red squares) effectively complements the sample of giants with large angular lengths (blue dots) from the manual search of Oei et al. (2023a). The remaining giants (green pluses) are from earlier literature, as specified in Sect. 4.8.
Current usage metrics show cumulative count of Article Views (full-text article views including HTML views, PDF and ePub downloads, according to the available data) and Abstracts Views on Vision4Press platform.
Data correspond to usage on the plateform after 2015. The current usage metrics is available 48-96 hours after online publication and is updated daily on week days.
Initial download of the metrics may take a while.