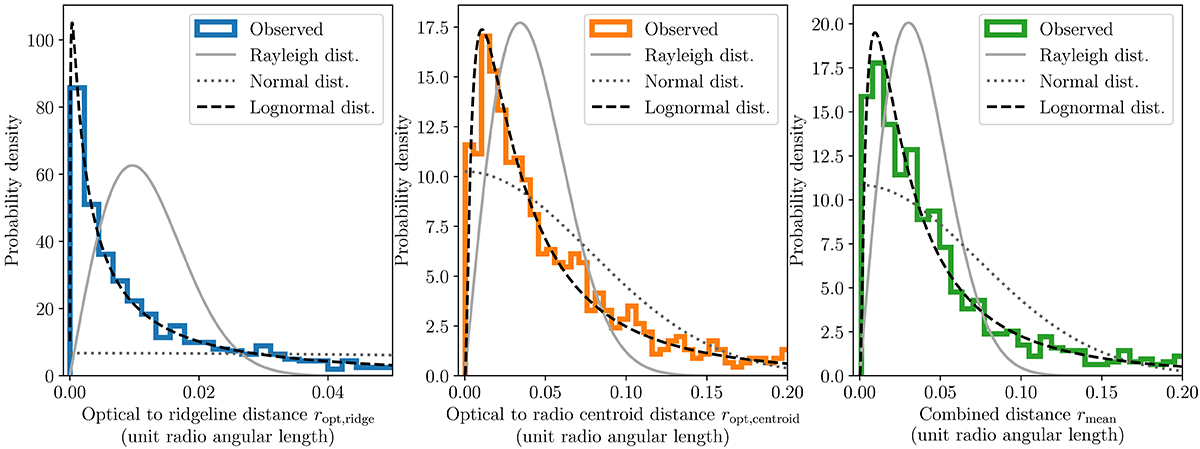
Fig. D.3.
Download original image
Each panel shows the histogram of a different distance measure between 905 radio galaxies with ϕ > 1′ and their optical host. The grey, dark grey, and black lines show empirical fits to these histograms for Rayleigh, normal, and lognormal distributions respectively. The tails of the histograms are long; for visualisation purposes we only plot the r-axis up to 0.05, 0.20, and 0.20.
Current usage metrics show cumulative count of Article Views (full-text article views including HTML views, PDF and ePub downloads, according to the available data) and Abstracts Views on Vision4Press platform.
Data correspond to usage on the plateform after 2015. The current usage metrics is available 48-96 hours after online publication and is updated daily on week days.
Initial download of the metrics may take a while.