Fig. 1.
Download original image
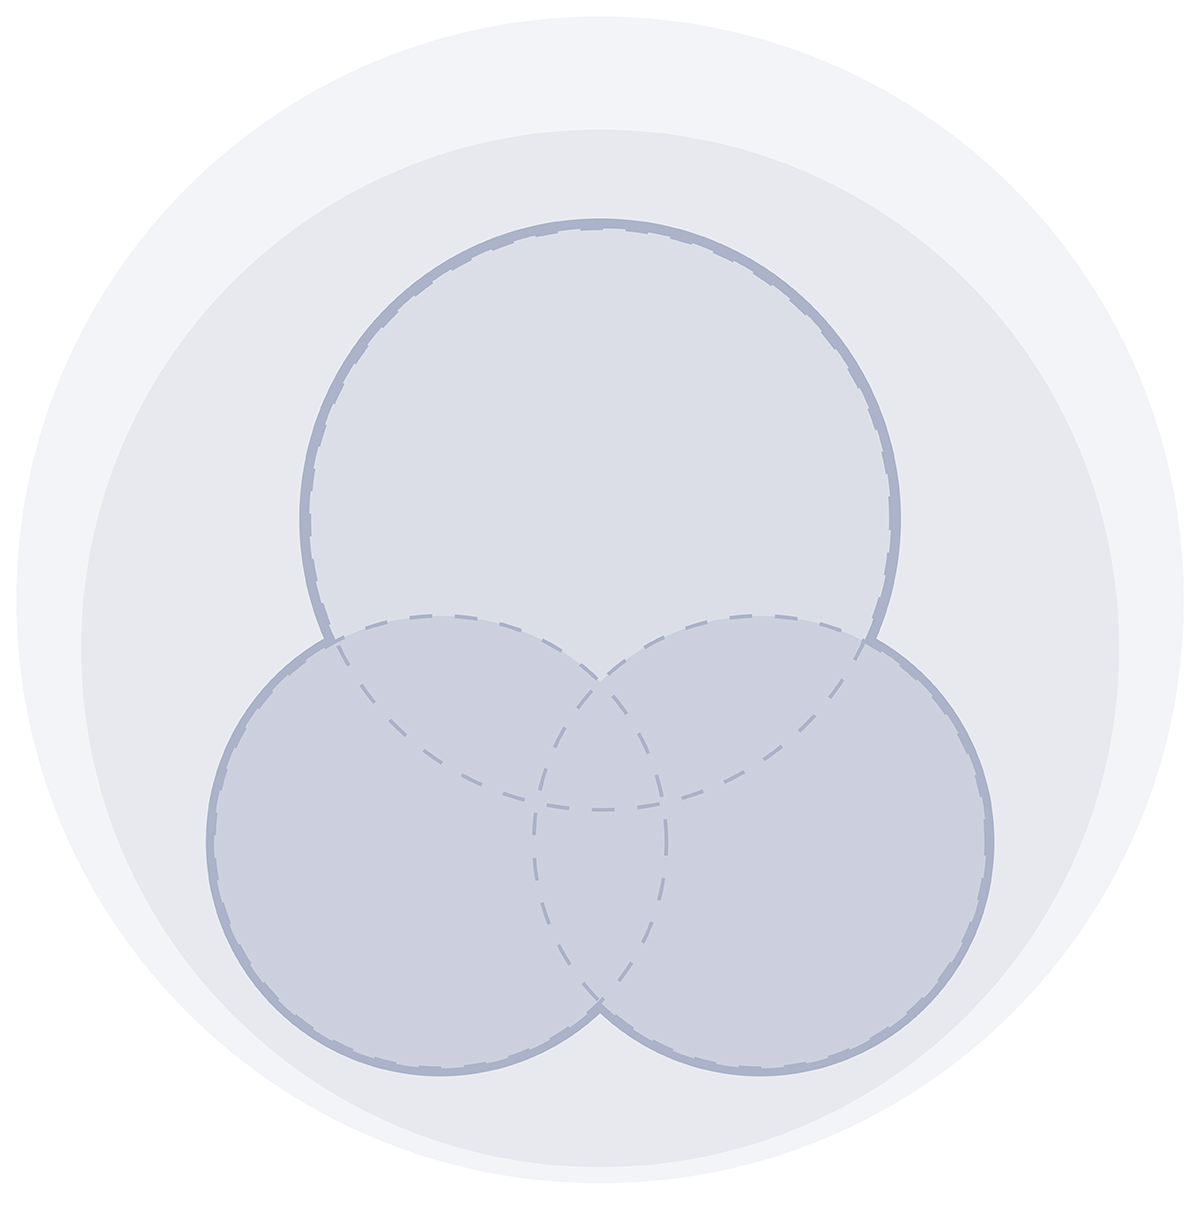
Schematic of a three-method search for giants. Of all giants in the survey footprint up to z = zmax, only those for which the lobe surface brightness at the observing frequency νobs is above detection threshold bν, th are identifiable. 𝒢 denotes the actually identified set of giants. 𝒢1, 𝒢2, and 𝒢3 are the subsets identified by each method individually. As an example, we shade 𝒢2 ∪ 𝒢3, which has overlap with 𝒢1, and which can be used to measure pobs, ID, 1(lp, z).
Current usage metrics show cumulative count of Article Views (full-text article views including HTML views, PDF and ePub downloads, according to the available data) and Abstracts Views on Vision4Press platform.
Data correspond to usage on the plateform after 2015. The current usage metrics is available 48-96 hours after online publication and is updated daily on week days.
Initial download of the metrics may take a while.