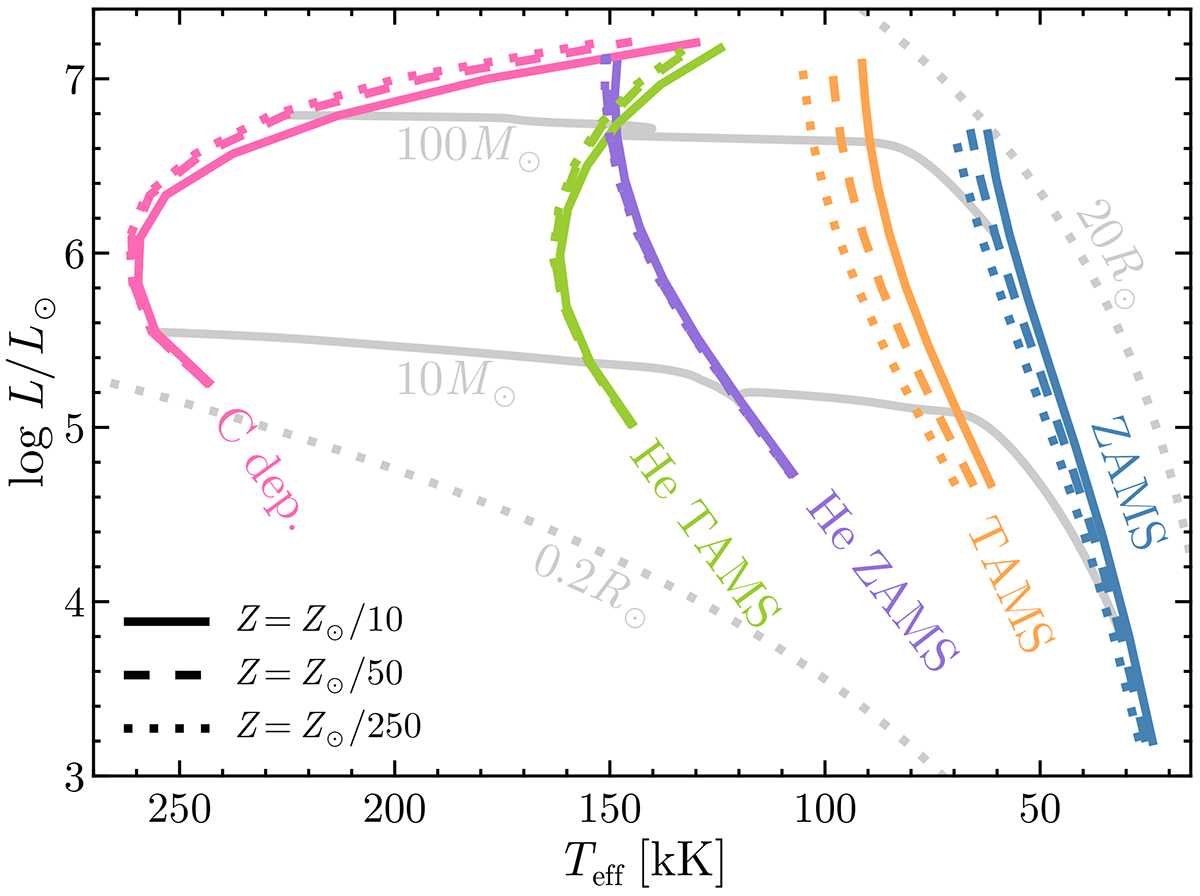
Fig. 1.
Download original image
Mock CHE models described in Sect. 2 on the Hertzsprung-Russell diagram. Colors indicate different evolutionary stages, including the ZAMS, TAMS, helium ZAMS and TAMS, and core carbon depletion (C dep.). Simulations cover the mass range 6.3–251 M⊙ and were performed without mass loss. Different line styles indicate different metallicity values. Two evolutionary tracks with a metallicity of Z⊙/50 and masses of 10 M⊙ and 100 M⊙ are shown in gray for reference.
Current usage metrics show cumulative count of Article Views (full-text article views including HTML views, PDF and ePub downloads, according to the available data) and Abstracts Views on Vision4Press platform.
Data correspond to usage on the plateform after 2015. The current usage metrics is available 48-96 hours after online publication and is updated daily on week days.
Initial download of the metrics may take a while.