Fig. 8.
Download original image
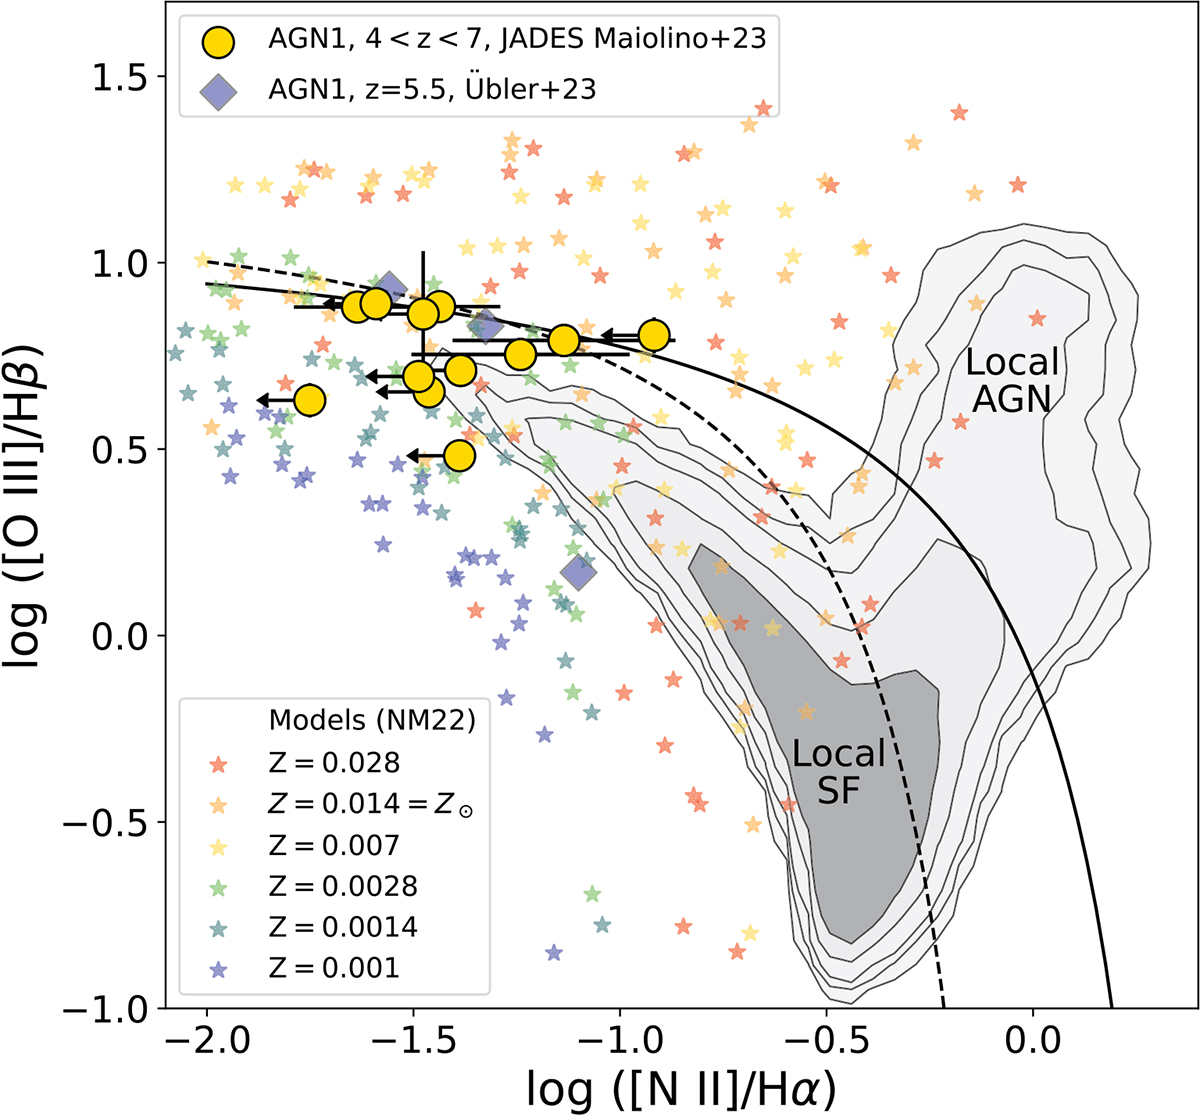
[NII]-BPT diagram. Contours show the distribution of galaxies in the local Universe from SDSS (DR7), showing the AGN sequence (right) and the star-forming sequence (left). The solid and dashed lines are the corresponding dividing lines from Kewley et al. (2001) and Kauffmann et al. (2003), respectively. The JADES broad-line AGNs presented in this paper are shown with golden circles, while blue diamonds show the values obtained by Übler et al. (2023) for an AGN at z = 5.5. Stars show predictions by AGN photoionisation models from Nakajima & Maiolino (2022) colour-coded by metallicity.
Current usage metrics show cumulative count of Article Views (full-text article views including HTML views, PDF and ePub downloads, according to the available data) and Abstracts Views on Vision4Press platform.
Data correspond to usage on the plateform after 2015. The current usage metrics is available 48-96 hours after online publication and is updated daily on week days.
Initial download of the metrics may take a while.