| Issue |
A&A
Volume 690, October 2024
|
|
|---|---|---|
| Article Number | C3 | |
| Number of page(s) | 2 | |
| Section | Extragalactic astronomy | |
| DOI | https://doi.org/10.1051/0004-6361/202451953e | |
| Published online | 24 October 2024 | |
The history of star-forming regions in the tails of six GASP jellyfish galaxies observed with the Hubble Space Telescope (Corrigendum)
1
INAF-Osservatorio Astronomico di Padova, Vicolo dell’Osservatorio 5, 35122 Padova, Italy
2
Dipartimento di Fisica e Astronomia, Università di Padova, Vicolo Osservatorio 3, 35122 Padova, Italy
3
Flatiron Institute, CCA, 162 5th Avenue, New York, NY 10010, USA
4
Instituto de Radioastronomía y Astrofísica, Universidad Nacional Autónoma de México, Morelia, Michoacán 58089, Mexico
5
Department of Physics, Faculty of Science, University of Zagreb, Bijenička 32, 10 000 Zagreb, Croatia
6
Departamento de Física, Universidad Técnica Federico Santa María, Avenida Vicuña Mackenna 3939, San Joaquín, Santiago, Chile
7
INAF-Osservatorio Astronomico di Brera, via Brera 28, I-20121 Milano, Italy
⋆ Corresponding author; This email address is being protected from spambots. You need JavaScript enabled to view it.
Key words: galaxies: clusters: general / galaxies: evolution / galaxies: ISM / galaxies: star formation / errata, addenda
This corrigendum provides a correction to the plots shown in the top row of panels in Fig. 6 in Werle et al. (2024). In the original paper, the y-axis in these plots displays an incorrect scale. However, we note that this problem was introduced shortly before submitting the paper, and our interpretation of the results was based on a previous (and correct) version of the figure. Therefore, all conclusions in the original paper are maintained. The data submitted to the CDS as complementary material are also correct. We show the correct version of the plots in Fig. 1; it is important to note that only the top panels are different from the original.
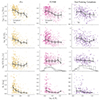 |
Fig. 1. Corrected version of Fig. 6 from Werle et al. (2024). The correction affects only the top row. |
The problem was caused by an incompatibility between the python code used to create the plot and an update in the data processing pipeline that organizes the value added data products resulting from the stellar population modeling. The bug led the logarithm of the mass-weighted stellar age to be taken in two different steps, resulting in the incorrect plots.
References
- Werle, A., Giunchi, E., Poggianti, B., et al. 2024, A&A, 682, A162 [NASA ADS] [CrossRef] [EDP Sciences] [Google Scholar]
© The Authors 2024
 Open Access article, published by EDP Sciences, under the terms of the Creative Commons Attribution License (https://creativecommons.org/licenses/by/4.0), which permits unrestricted use, distribution, and reproduction in any medium, provided the original work is properly cited.
This article is published in open access under the Subscribe to Open model. This email address is being protected from spambots. You need JavaScript enabled to view it. to support open access publication.
All Figures
|
Fig. 1. Corrected version of Fig. 6 from Werle et al. (2024). The correction affects only the top row. |
| In the text | |
Current usage metrics show cumulative count of Article Views (full-text article views including HTML views, PDF and ePub downloads, according to the available data) and Abstracts Views on Vision4Press platform.
Data correspond to usage on the plateform after 2015. The current usage metrics is available 48-96 hours after online publication and is updated daily on week days.
Initial download of the metrics may take a while.