Open Access
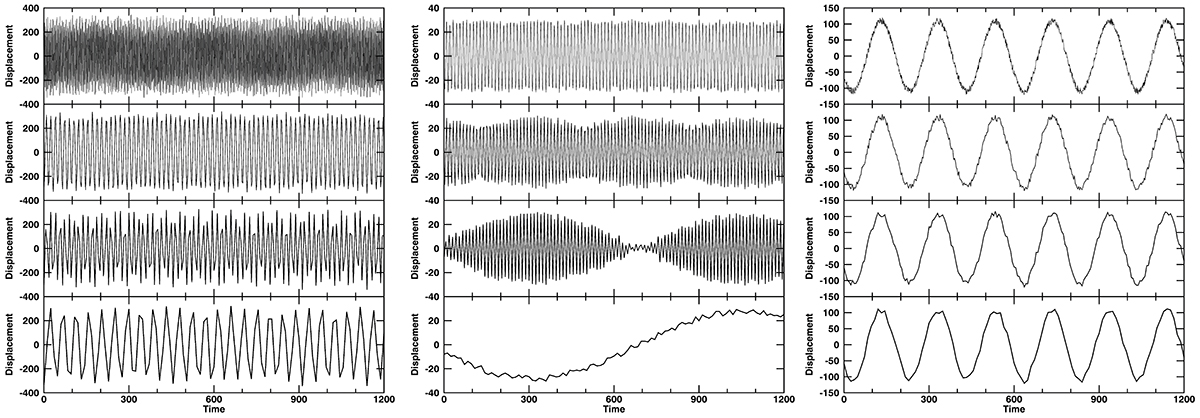
Fig. 3.
Download original image
Examples of original signals (top), and sampled signals at 3 s (second row), 6 s (third row), and 12 s (fourth row). Left panels: True periods and detected periods from sampled signals from top to bottom are 1, 16, 16, and 45 s. Middle panels: 12, 12, 12, and 1455 s. Right panels: 200, 200, 200, and 200 s.
Current usage metrics show cumulative count of Article Views (full-text article views including HTML views, PDF and ePub downloads, according to the available data) and Abstracts Views on Vision4Press platform.
Data correspond to usage on the plateform after 2015. The current usage metrics is available 48-96 hours after online publication and is updated daily on week days.
Initial download of the metrics may take a while.