Fig. 8.
Download original image
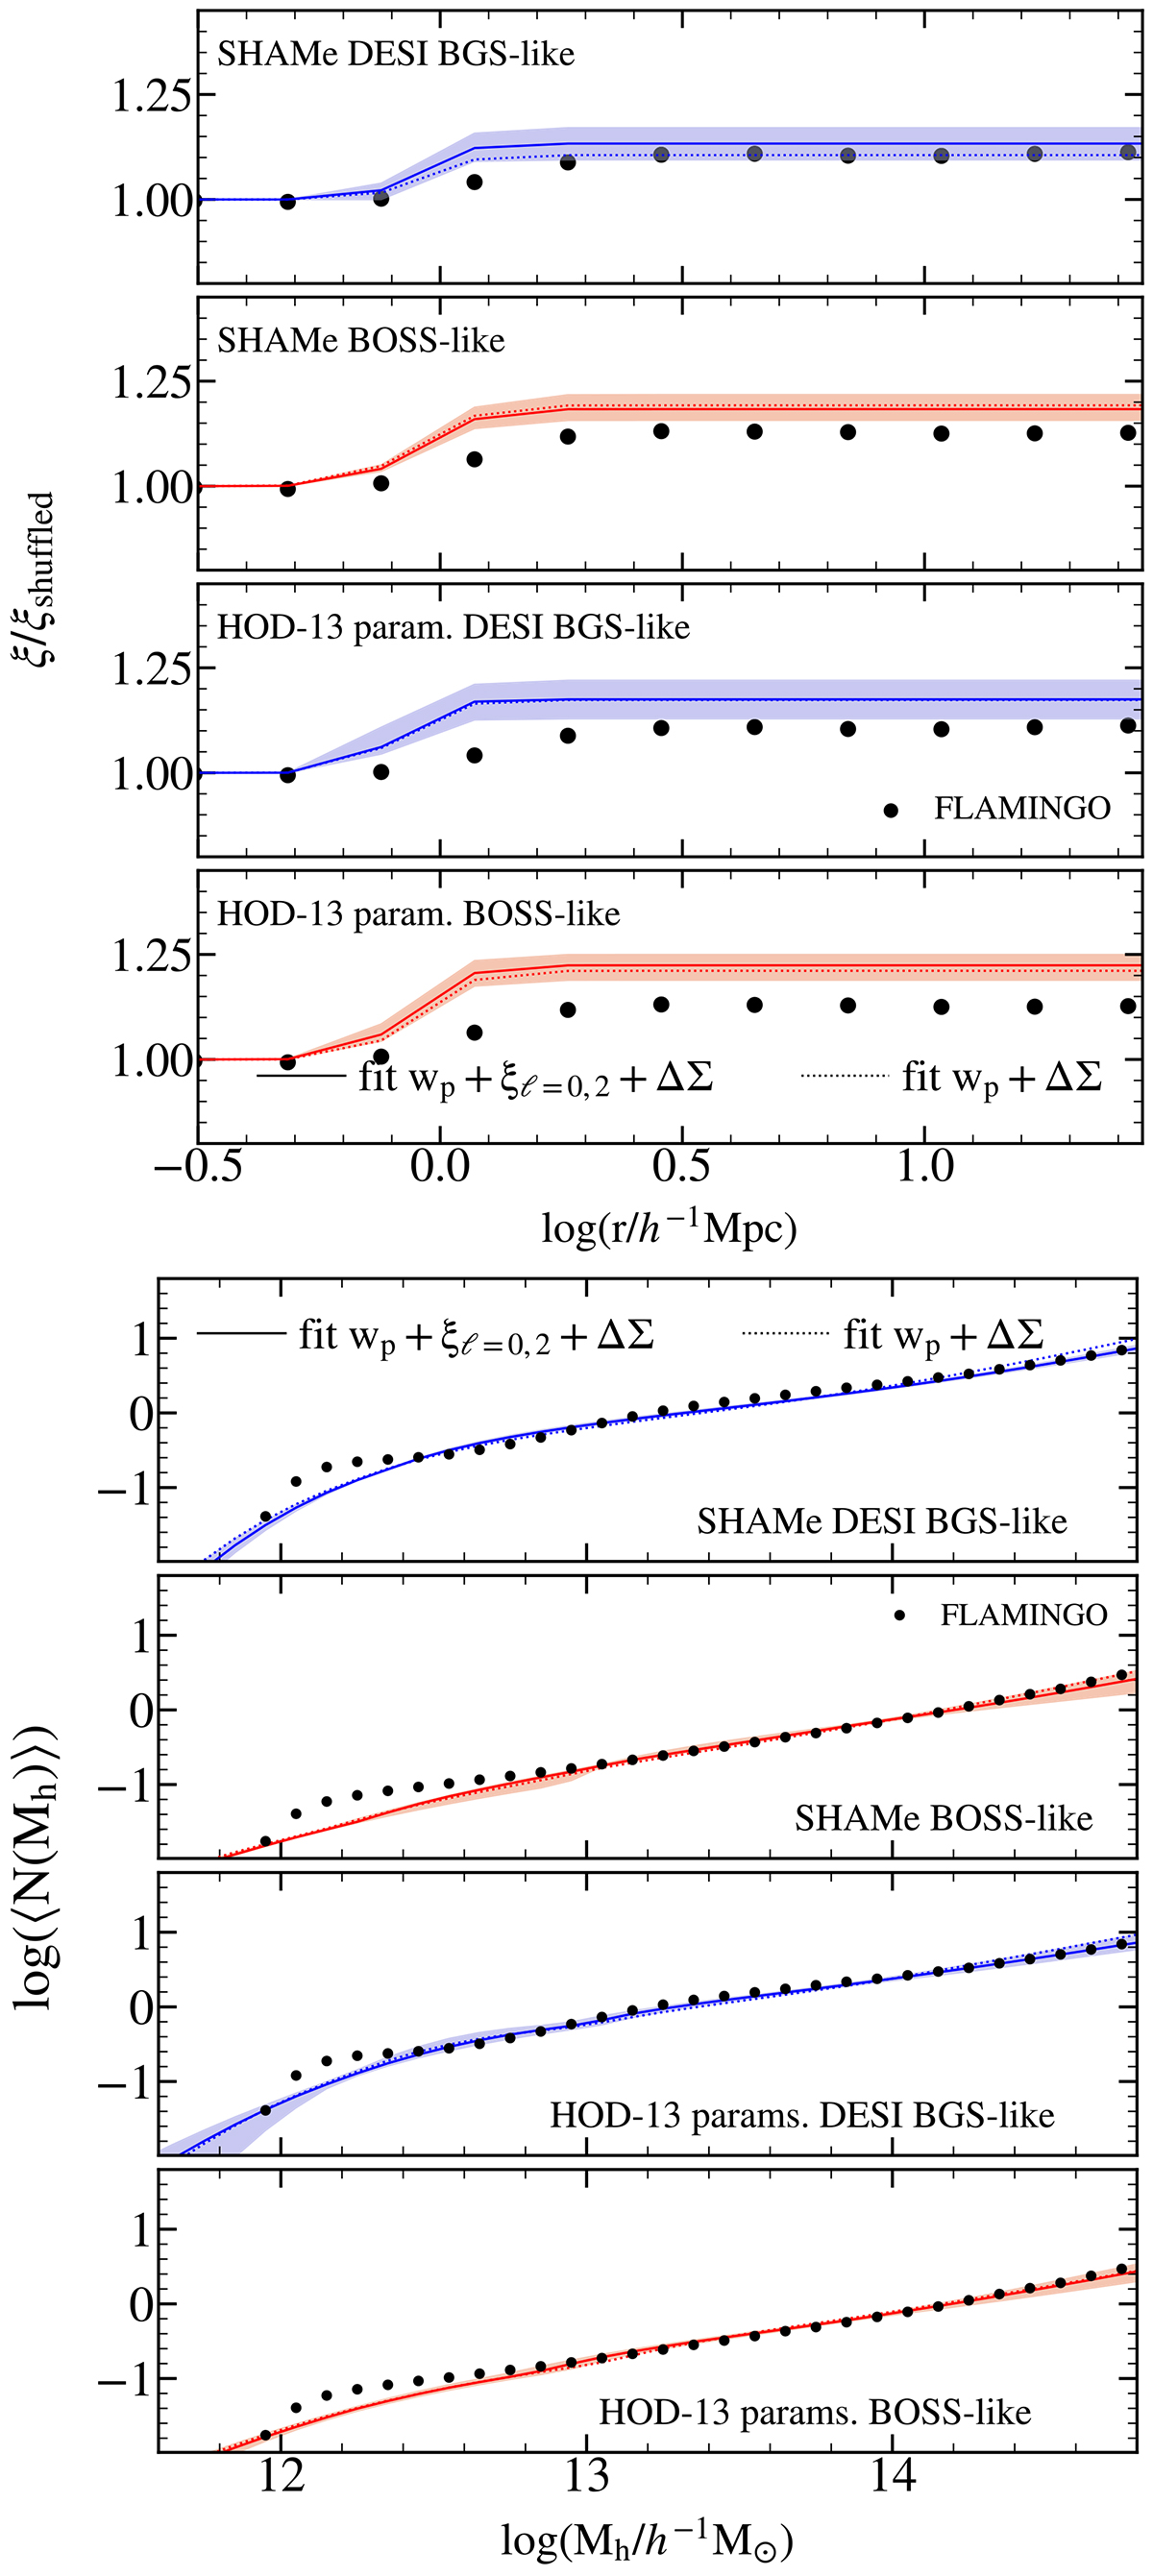
(Top) Galaxy assembly bias of the FLAMINGO simulation (dots points) and the empirical models when fitting to the galaxy clustering and galaxy-galaxy lensing predicted by FLAMINGO. From top to bottom, we show the SHAMe predictions for the DESI BGS-like galaxies, the SHAMe predictions for the BOSS-like galaxies, the HOD predictions for the DESI BGS-like galaxies, and the HOD predictions for the BOSS-like galaxies. The shaded region around the solid line represents the 1-σ prediction region for the empirical models, as is explained in Sect. 3.4. (Bottom) Similar to the top panel, but for the halo occupation number.
Current usage metrics show cumulative count of Article Views (full-text article views including HTML views, PDF and ePub downloads, according to the available data) and Abstracts Views on Vision4Press platform.
Data correspond to usage on the plateform after 2015. The current usage metrics is available 48-96 hours after online publication and is updated daily on week days.
Initial download of the metrics may take a while.