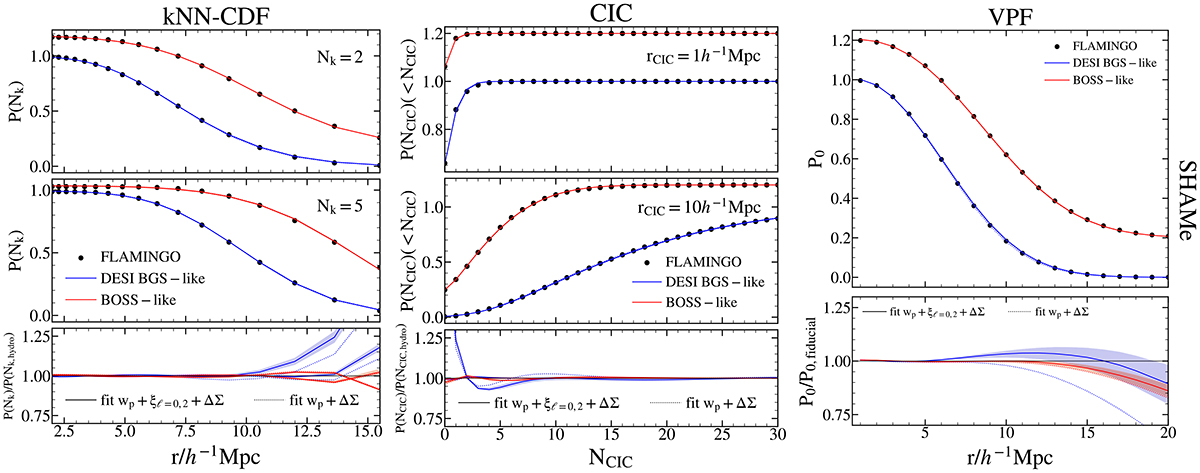
Fig. 6.
Download original image
k-nearest neighbour cumulative distribution functions (kNN-CDF, left panel), count-in-cylinder (CIC, middle panel), and void probability function (VPF, right panel) of the FLAMINGO simulation (symbols) and the SHAMe model (lines). The results for BOSS-like, shown in red, are displaced along the y axis to facilitate the comparison. The different line styles represent the statistics used to fit FLAMINGO as labelled. The lines represent the median of 1000 MCMC points when fitting the projected correlation function and the galaxy-galaxy lensing (dotted lines), as well as the projected correlation function, multipoles of the correlation function, and galaxy-galaxy lensing (solid lines). It is worth noting that none of the statistics shown in this figure were used in the empirical model fitting process. The shaded region corresponds to the 16th and 84th percentile of the distribution (only shown for the solid line). Only the predictions for Nk = 2 and 5 are shown for the kNN-CDF. Similarly, the CIC only shows the predictions for rCIC = 1 and 10 h−1 Mpc. The bottom panels show the ratio between the empirical models and FLAMINGO.
Current usage metrics show cumulative count of Article Views (full-text article views including HTML views, PDF and ePub downloads, according to the available data) and Abstracts Views on Vision4Press platform.
Data correspond to usage on the plateform after 2015. The current usage metrics is available 48-96 hours after online publication and is updated daily on week days.
Initial download of the metrics may take a while.