Fig. 2.
Download original image
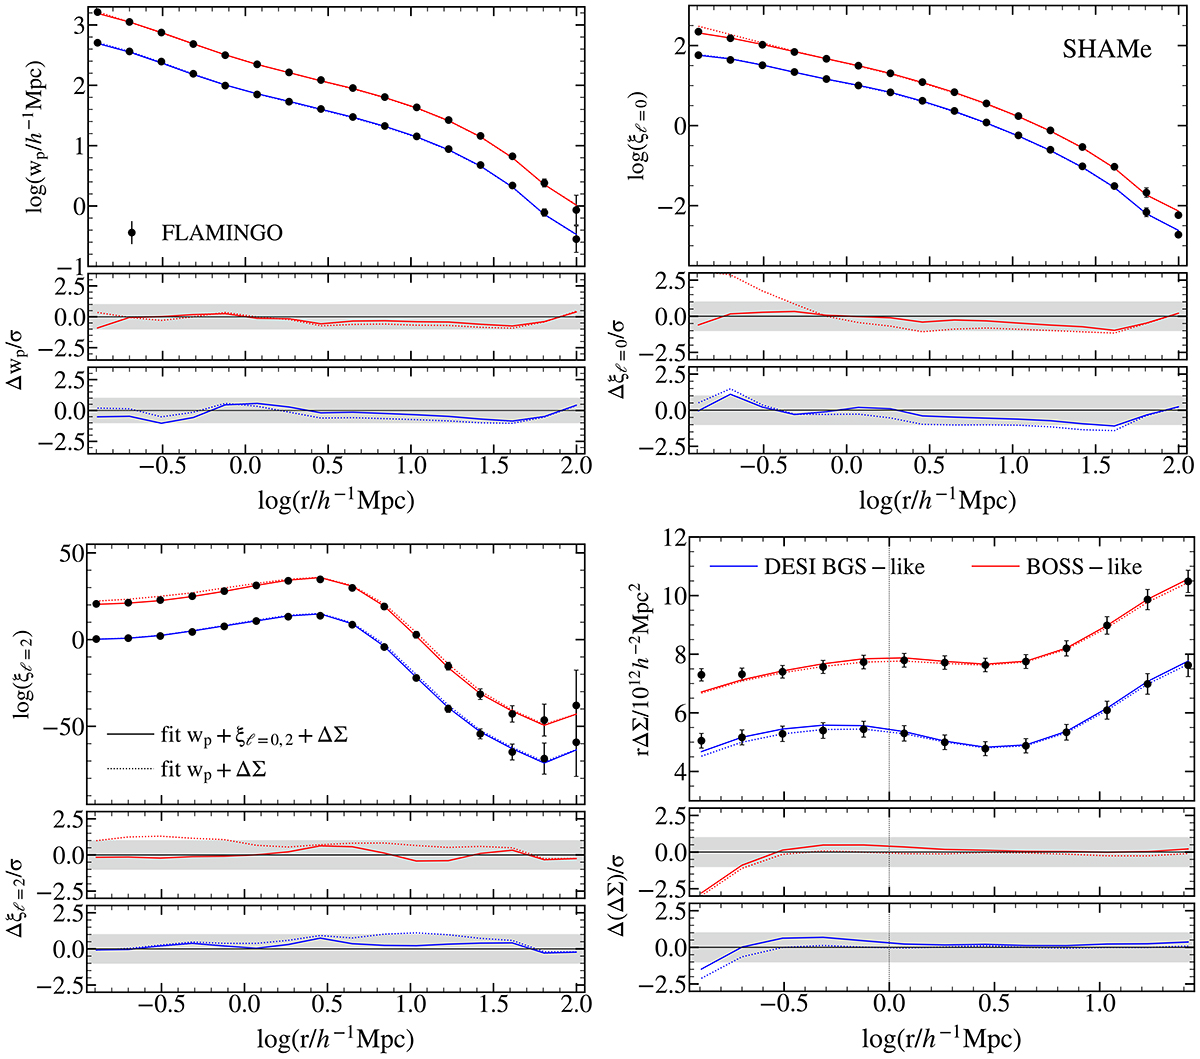
Galaxy clustering (wp, top left panel; ξℓ = 0, top right panel; ξℓ = 2, lower left panel) and galaxy-galaxy lensing (ΔΣ, lower right panel) for the FLAMINGO simulation (symbols) and the SHAMe model (lines). The results for the BOSS-like sample, shown in red, are displaced along the y axis for clarity. The different line styles represent the statistics used to fit FLAMINGO. The solid line corresponds to the best-fitting model when fitting to the projected correlation function, the monopole and quadrupole of the correlation function, and the galaxy-galaxy lensing. The dotted line corresponds to the best-fitting model when fitting only to the projected correlation function and the galaxy-galaxy lensing. The bottom subpanels show the difference between the empirical model and FLAMINGO, normalised by the error in each point. The fits are performed for all scales shown for the galaxy clustering statistics and for scales above 1 h−1 Mpc for galaxy-galaxy lensing (denoted by a vertical line in the bottom right panel) to avoid baryonic effects.
Current usage metrics show cumulative count of Article Views (full-text article views including HTML views, PDF and ePub downloads, according to the available data) and Abstracts Views on Vision4Press platform.
Data correspond to usage on the plateform after 2015. The current usage metrics is available 48-96 hours after online publication and is updated daily on week days.
Initial download of the metrics may take a while.