Fig. C.2.
Download original image
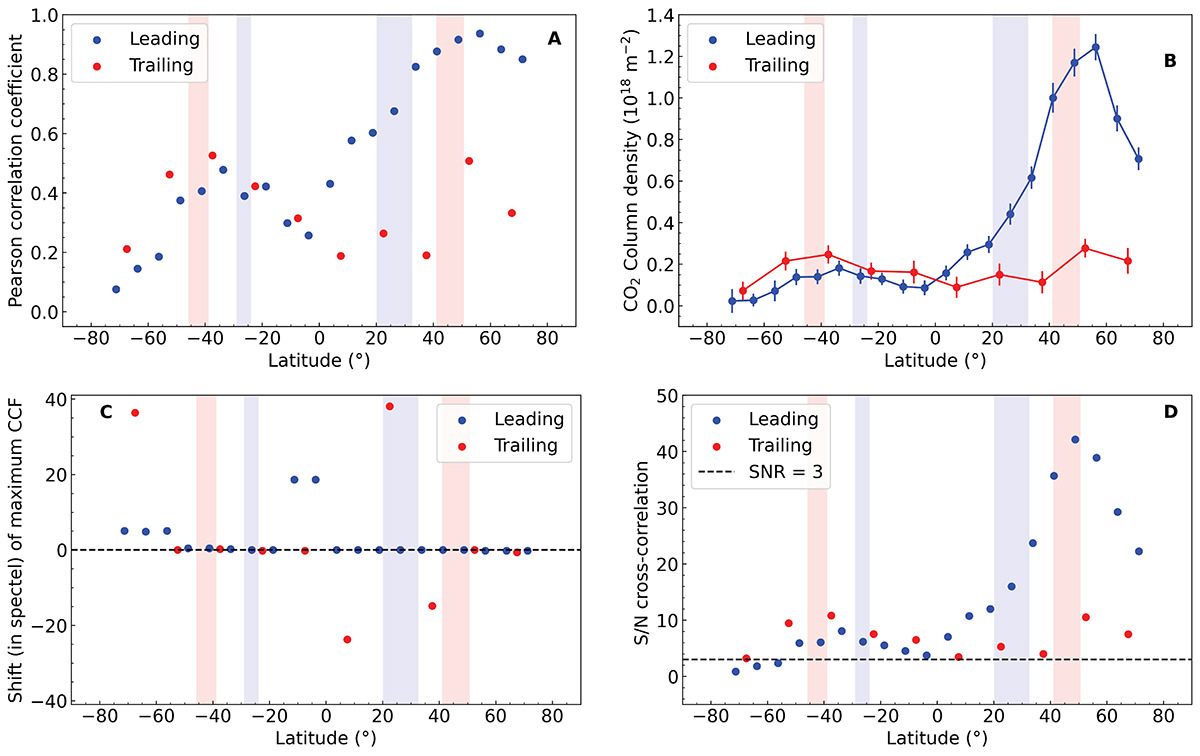
Study of 4.22–4.295 μm spectra averaged over latitude bins. A) Pearson correlation coefficient between residual CO2 DIFF spectra and a synthetic DIFF spectrum which uses a CO2 fluorescence synthetic spectrum at T = 105 K as input. B) CO2 line-of-sight column density retrieved from the fit of CO2 DIFF spectra. C) shift, in fraction of spectel, of the maximum of the cross-correlation function (CCF) between CO2 DIFF spectra and the synthetic DIFF spectrum; secure detection is indicated when the shift is close to zero. D) S/N of the cross-correlation function at shift = 0. The S/N is obtained by computing the CCFnoise obtained by using as input a simulated noisy spectrum, with the r.m.s deduced from the ERR entry in the Level 3 data cube, and scaled in ![]() , where n is the number of averaged spaxels (S/N = CCF/CCFnoise at shift = 0). In all plots, blue and red symbols correspond to the leading and trailing sides, respectively. The blue (resp. pink) vertical domains show the latitude range of the open-closed field-line boundaries for the leading and trailing sides, respectively, restricted to longitudes of 10–130° W (leading) and 210–330° W (trailing).
, where n is the number of averaged spaxels (S/N = CCF/CCFnoise at shift = 0). In all plots, blue and red symbols correspond to the leading and trailing sides, respectively. The blue (resp. pink) vertical domains show the latitude range of the open-closed field-line boundaries for the leading and trailing sides, respectively, restricted to longitudes of 10–130° W (leading) and 210–330° W (trailing).
Current usage metrics show cumulative count of Article Views (full-text article views including HTML views, PDF and ePub downloads, according to the available data) and Abstracts Views on Vision4Press platform.
Data correspond to usage on the plateform after 2015. The current usage metrics is available 48-96 hours after online publication and is updated daily on week days.
Initial download of the metrics may take a while.