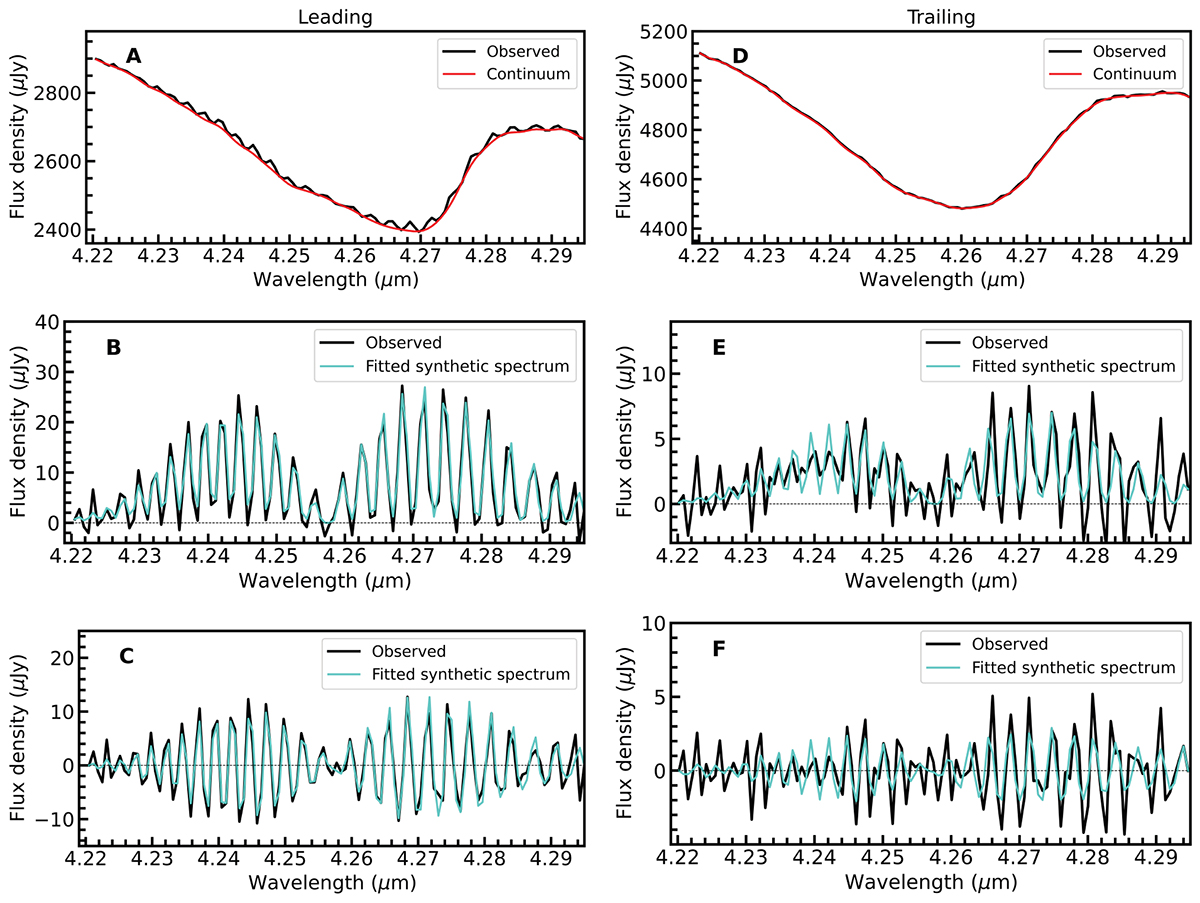
Fig. B.1.
Download original image
CO2ν3 band gas spectra from Ganymede’s exosphere. Left (A–C): North polar cap of the leading side of Ganymede (averaged spectra for latitudes > 45° N); Right (D–F): Southern hemisphere of the trailing side (latitudes 30–60° S). A, D) Observed spectra showing both the CO2ν3 absorption band from CO2 in solid state, and ro-vibrational emission lines of gaseous CO2; B, E) CO2 gaseous emission spectra obtained after removing the continuum emission shown in red in panels A and D (Appendix B). C, F) Residual CO2-gas DIFF spectra obtained by removing the continuum obtained from low-pass filtering (Appendix B). Best fit synthetic spectra are shown in blue, with a fitted rotational temperature of 108±8 K for the leading side, and a fixed rotational temperature of 105 K for the trailing side. In all plots, vertical-axis unit is μJy per pixel (1 pixel = 0.1”× 0.1”).
Current usage metrics show cumulative count of Article Views (full-text article views including HTML views, PDF and ePub downloads, according to the available data) and Abstracts Views on Vision4Press platform.
Data correspond to usage on the plateform after 2015. The current usage metrics is available 48-96 hours after online publication and is updated daily on week days.
Initial download of the metrics may take a while.