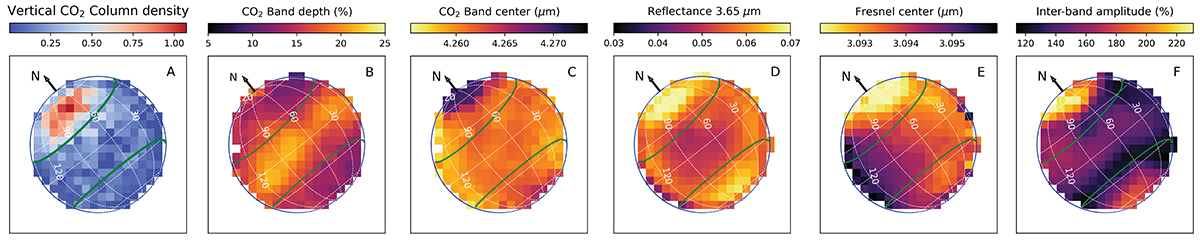
Fig. 4.
Download original image
Comparing CO2 exosphere to surface properties on Ganymede’s leading hemisphere. (A) Vertical CO2 gas column density (in units of 1018 m−2, this work, see also Fig. O.2); (B) Depth of CO2-solid absorption band (Paper I); (C) Central wavelength of CO2-solid absorption band (Paper I); (D) Reflectance at 3.65 μm (Paper I); (E) Central wavelength of H2O Fresnel peak (Paper I); (F) Relative amplitude of the maximum reflectance between 3.5 and 4 μm (H2O interband amplitude, Paper I). The north pole of the leading hemisphere possesses the most redshifted absorption band center of solid CO2, consistent with CO2 trapped in amorphous H2O ice (Paper I). It also has the highest reflectance at 3.65 μm and H2O interband amplitude, indicative of a higher density of facets in H2O ice for the photons (i.e., smaller grains and/or more internal defects and/or higher micro-roughness or porosity), and the most blueshifted central wavelength of the H2O Fresnel peak due to a higher proportion of amorphous water ice (Mastrapa et al. 2009).
Current usage metrics show cumulative count of Article Views (full-text article views including HTML views, PDF and ePub downloads, according to the available data) and Abstracts Views on Vision4Press platform.
Data correspond to usage on the plateform after 2015. The current usage metrics is available 48-96 hours after online publication and is updated daily on week days.
Initial download of the metrics may take a while.