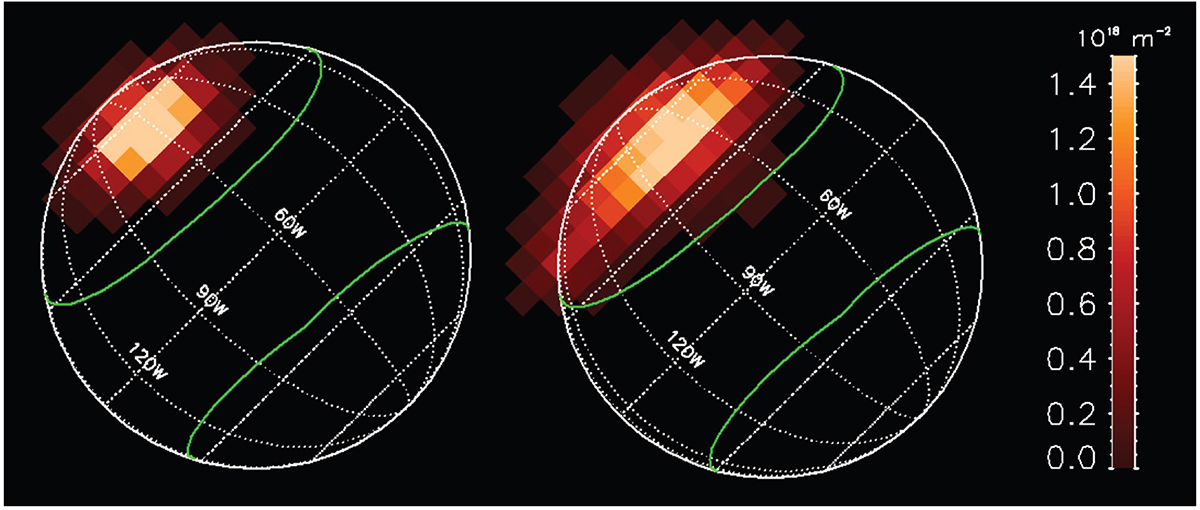
Fig. 3.
Download original image
Calculated line-of-sight column-density maps of the CO2 exosphere of Ganymede above the leading side from the EGM model (in units of 1018 m−2). Left: CO2 release associated with H2O sublimation with a CO2/H2O relative abundance of 5 for an H2O areal ice fraction of 50% at latitudes > 50°N. Right: Sputtering of H2O ice with CO2/H2O = 0.01 at latitudes > 40°N; the result was multiplied by 382 to match the observations (Appendices K, L). The green lines display the OCFBs. The subsolar point is at 2.6°N, 82°W.
Current usage metrics show cumulative count of Article Views (full-text article views including HTML views, PDF and ePub downloads, according to the available data) and Abstracts Views on Vision4Press platform.
Data correspond to usage on the plateform after 2015. The current usage metrics is available 48-96 hours after online publication and is updated daily on week days.
Initial download of the metrics may take a while.