Fig. O.2.
Download original image
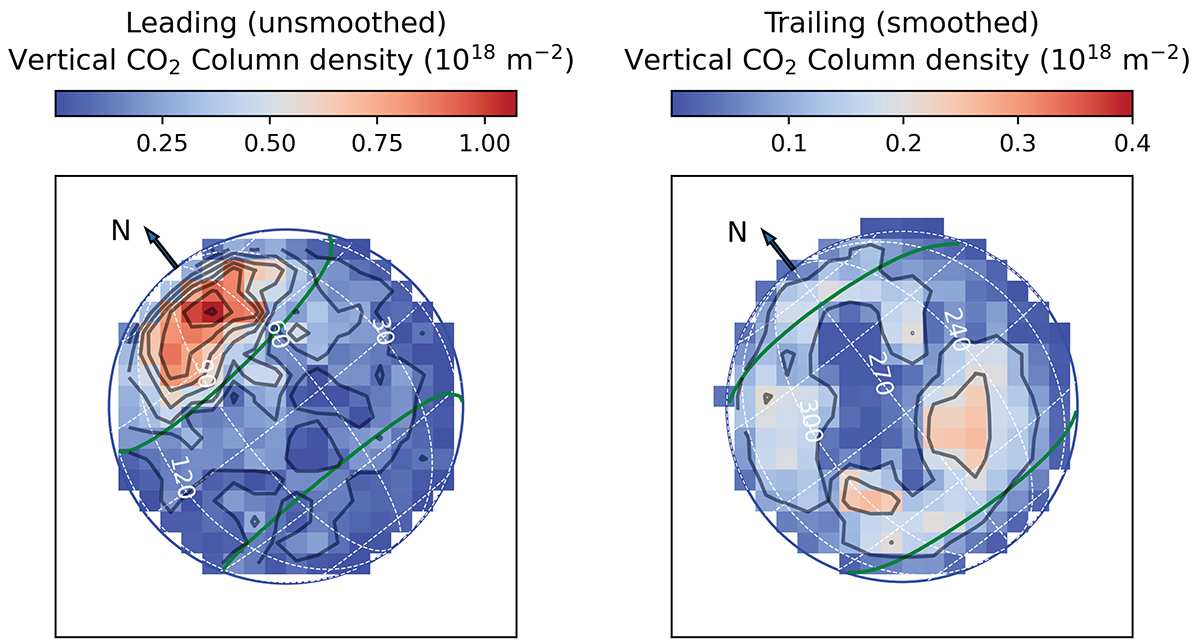
CO2 vertical column density maps of the leading (left) and trailing (right) hemispheres. They were deduced from the line-of-sight column density maps, by multiplying them by the cosine of the angle between local zenith and line of sight directions. For the leading hemisphere, the central contour for the north excess is at about 72°W (12.6 h local time), 45°N. Trailing data were smoothed using a 3×3 boxcar filter.
Current usage metrics show cumulative count of Article Views (full-text article views including HTML views, PDF and ePub downloads, according to the available data) and Abstracts Views on Vision4Press platform.
Data correspond to usage on the plateform after 2015. The current usage metrics is available 48-96 hours after online publication and is updated daily on week days.
Initial download of the metrics may take a while.