Fig. O.1.
Download original image
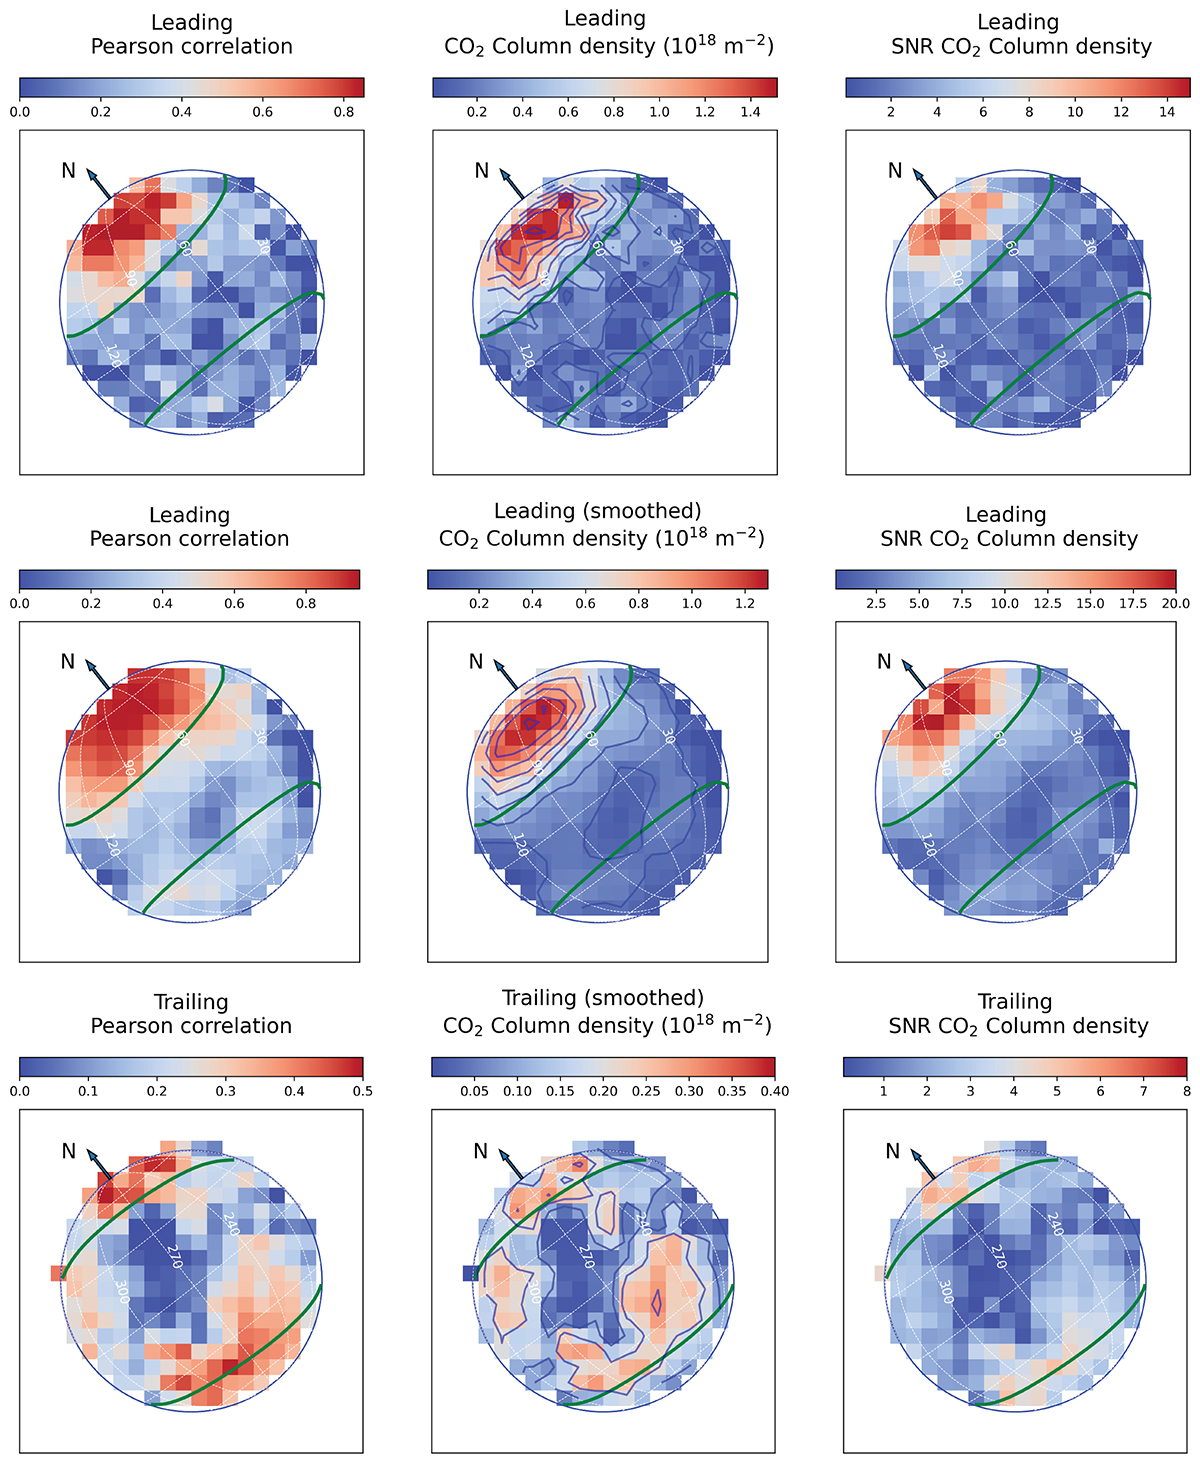
CO2 gas distribution above Ganymede surface. First and second rows are for the leading side, at the original and 3×3 boxcar smoothed (for higher S/N) resolutions, respectively. Bottom row is for the trailing side at 3×3 smoothed resolution. Plots on the first column show the Pearson correlation coefficient between continuum-filtered residual CO2 gas emission and a forward CO2 fluorescence model at 105 K (Fig. H.1). Plots on the second and third column show the line-of-sight CO2 column density and S/N inferred by fitting synthetic CO2 fluorescence spectra (Appendix B). The color scales for the leading and trailing sides are different, and indicated above the plots. Pixel sizes are 0.1×0.1”. The green lines show the open-closed field-line boundary Duling et al. (2022)
Current usage metrics show cumulative count of Article Views (full-text article views including HTML views, PDF and ePub downloads, according to the available data) and Abstracts Views on Vision4Press platform.
Data correspond to usage on the plateform after 2015. The current usage metrics is available 48-96 hours after online publication and is updated daily on week days.
Initial download of the metrics may take a while.