Fig. L.4.
Download original image
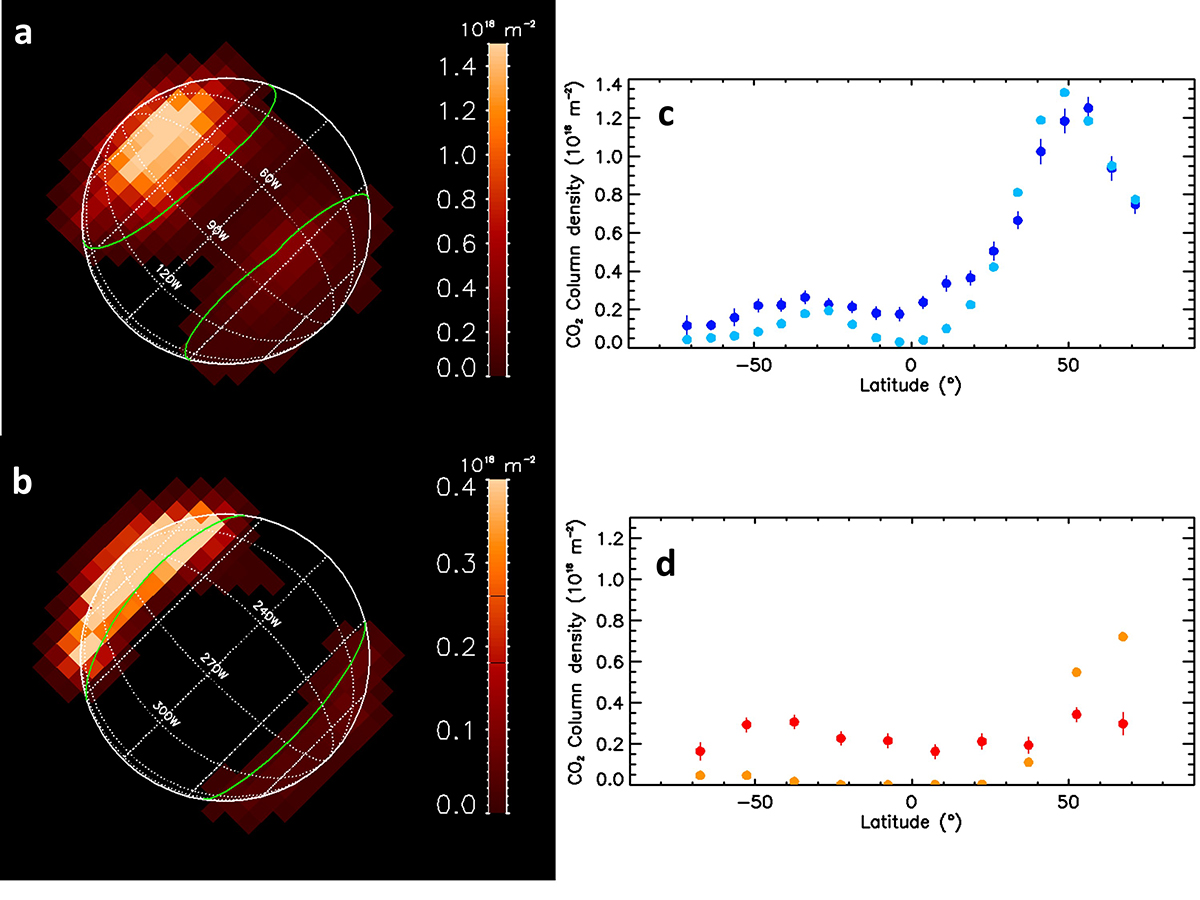
Simulation of the entire CO2 exosphere formed by sputtering only. No sputtering is simulated inside the closed-field-line region. Input parameters are given in the text. Panel a: 2D line-of-sight column density map of CO2 (in 1018 CO2/m2), Ganymede-leading side. Panel b: same as panel a but for the Ganymede-trailing side. Panel c: latitudinal variation of the longitudinal average column density for the Ganymede-leading side (for bins of 7.5° in latitude). Panel d: same as for panel c but for the Ganymede-trailing side and bins in latitude of 15°. Dark blue symbols: JWST observations. Light blue symbols: EGM simulation. Red symbols: JWST observations. Orange symbols: EGM simulation.
Current usage metrics show cumulative count of Article Views (full-text article views including HTML views, PDF and ePub downloads, according to the available data) and Abstracts Views on Vision4Press platform.
Data correspond to usage on the plateform after 2015. The current usage metrics is available 48-96 hours after online publication and is updated daily on week days.
Initial download of the metrics may take a while.