Fig. K.1.
Download original image
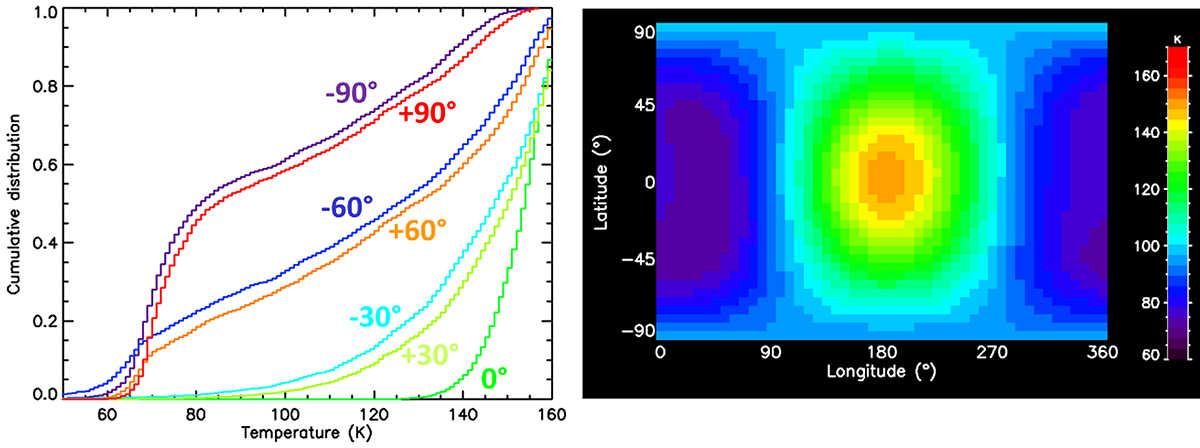
Ganymede’s surface temperature used in EGM model, representative of the leading hemisphere. Left panel: facet temperature distribution (cumulative probability) of the surface temperatures at 12 h local time for various latitudes indicated in the plot. Right panel: latitude/longitude map of the average surface temperature with the subsolar point being at a latitude of 2°N (as for JWST observations, Paper I) and longitude of 180°.
Current usage metrics show cumulative count of Article Views (full-text article views including HTML views, PDF and ePub downloads, according to the available data) and Abstracts Views on Vision4Press platform.
Data correspond to usage on the plateform after 2015. The current usage metrics is available 48-96 hours after online publication and is updated daily on week days.
Initial download of the metrics may take a while.