Fig. 8
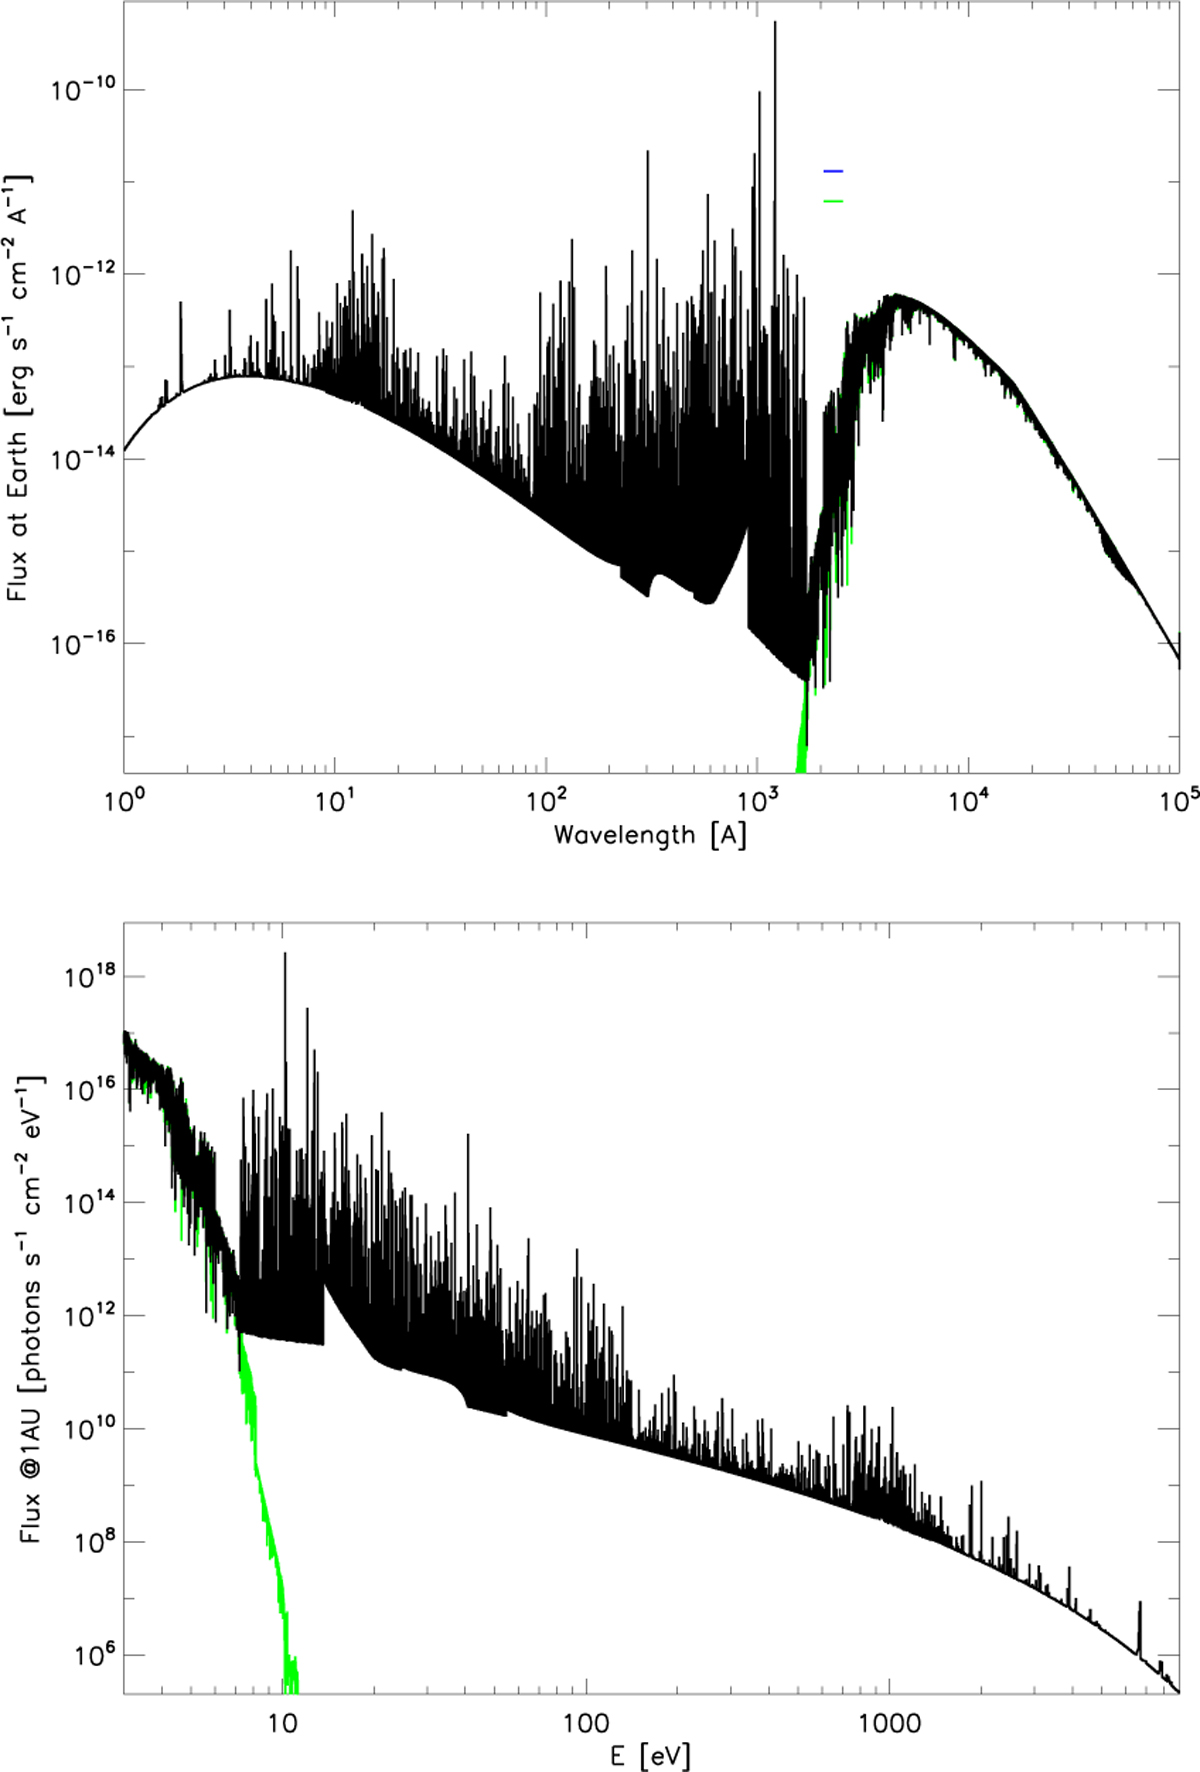
Download original image
Composite spectrum of HIP 67522 obtained by joining the Phoenix photospheric spectrum with the XUV spectrum synthesized from the reconstructed plasma emission measure distribution vs. temperature in the chromosphere, transition region, and corona. The upper panel shows the specific flux at Earth, while the bottom panel is the photon flux at a distance of 1 AU. The Phoenix spectrum resampled down to ~1700 Å with a wavelength resolution of 1 Å is shown in green; the XUV spectrum in the range 1–1700 Å is shown instead with a resolution of 0.01 Å. The green and blue segments in the upper panel, at ~200 nm, mark the Phoenix model flux and the observed flux integrated over the OM UVM2 band.
Current usage metrics show cumulative count of Article Views (full-text article views including HTML views, PDF and ePub downloads, according to the available data) and Abstracts Views on Vision4Press platform.
Data correspond to usage on the plateform after 2015. The current usage metrics is available 48-96 hours after online publication and is updated daily on week days.
Initial download of the metrics may take a while.