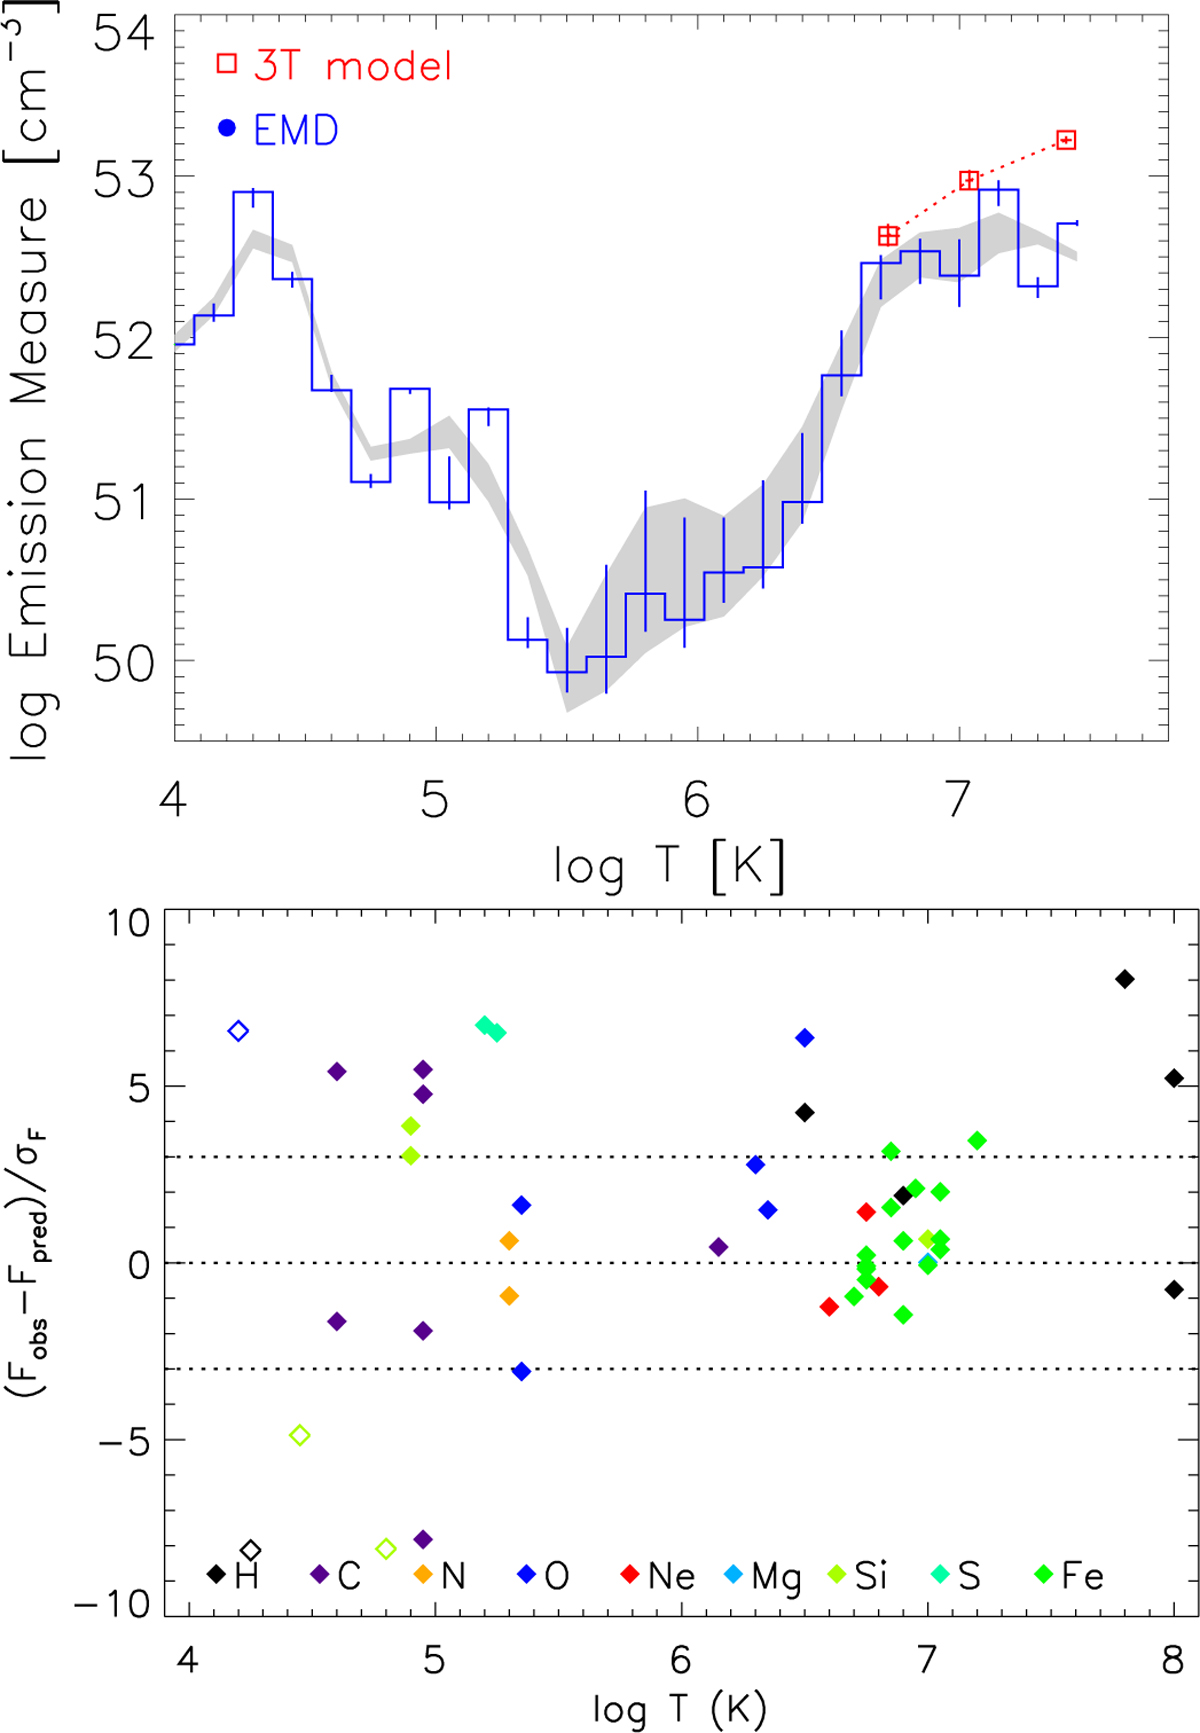
Fig. 6
Download original image
Results of the joint analysis of XMM-Newton/RGS and HST/COS spectra. Top: Plasma EMD vs. temperature, compared with the 3-T model (red points) best fitting the global EPIC and RGS spectra. The shaded band represents a smoothed 1σ confidence region. Bottom: differences, in σ units, between measured line fluxes and predicted values vs. temperature at the peak emissivity. The black “H” symbols represent narrow-band measurements of the X-ray continuum. Empty symbols are lines not used for the EMD reconstruction.
Current usage metrics show cumulative count of Article Views (full-text article views including HTML views, PDF and ePub downloads, according to the available data) and Abstracts Views on Vision4Press platform.
Data correspond to usage on the plateform after 2015. The current usage metrics is available 48-96 hours after online publication and is updated daily on week days.
Initial download of the metrics may take a while.