Open Access
Fig. 2
Download original image
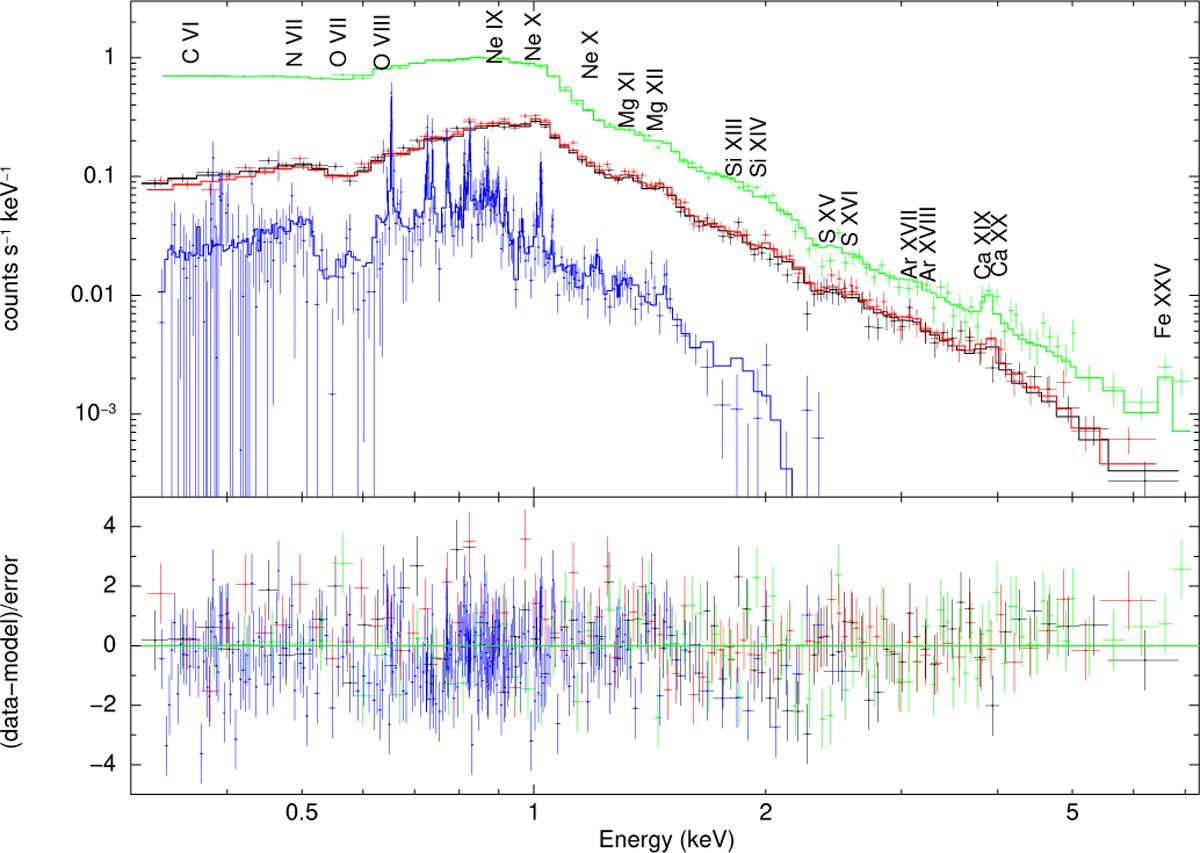
EPIC and RGS global spectra, and best-fit 3T VAPEC model. Black and red data points for the MOS1 and MOS2, while the pn spectrum is in green, and the summed RGS1+RGS2 spectra in blue. The main complexes of H-like and He-like ions are indicated.
Current usage metrics show cumulative count of Article Views (full-text article views including HTML views, PDF and ePub downloads, according to the available data) and Abstracts Views on Vision4Press platform.
Data correspond to usage on the plateform after 2015. The current usage metrics is available 48-96 hours after online publication and is updated daily on week days.
Initial download of the metrics may take a while.