Fig. 1
Download original image
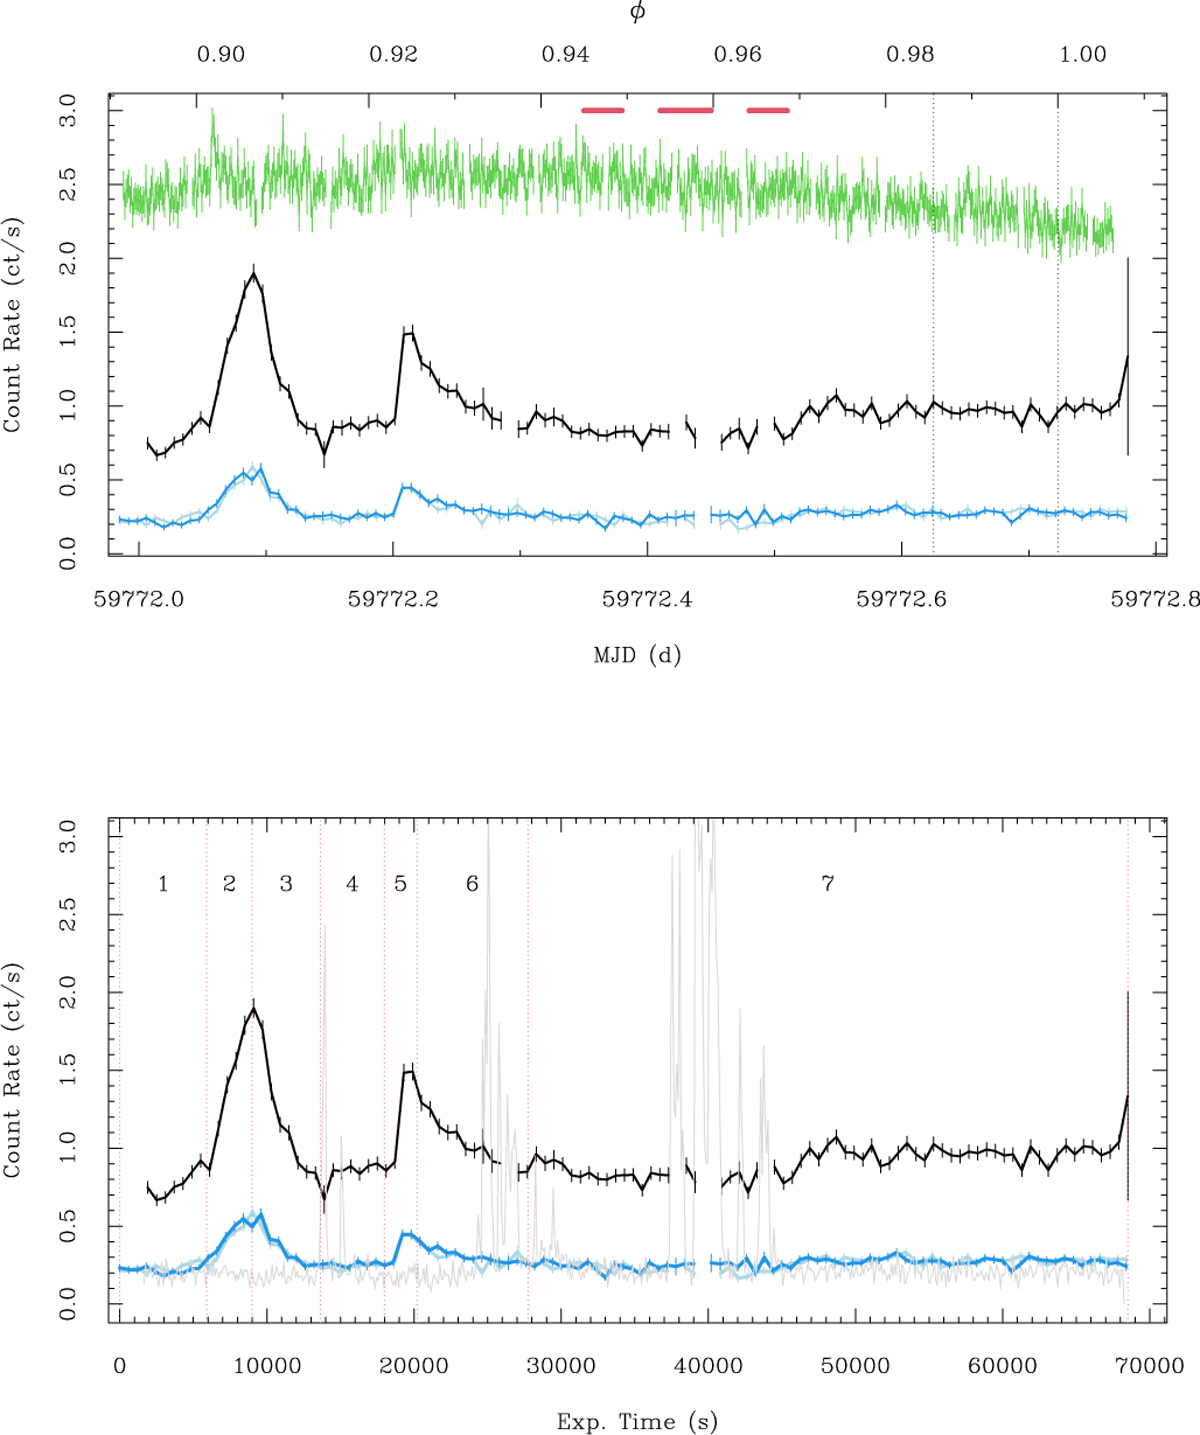
X-ray and NUV light curves of HIP 67522. Top: light curves of EPIC (black pn, dark and light blue MOS 1,2) and OM (green) instruments. The EPIC light curves were binned at 600 s per bin, while the OM light curve was binned at 90 s. The OM rate is divided by 5 for making easier the comparison. The horizontal bars on the top indicate the time of the HST/COS exposures. The top axis reports the orbital phases of the planet. The vertical dotted lines mark ingress and midtransit times of the planet. Bottom: EPIC light curves and time intervals defining flares 1 and 2 rise+peak and decay (2, 3, 5, 6) and quiescent levels (1, 4, 7). The gray light curve refers to background single events with energies between 10 keV and 12 keV, in the full field of view of the pn detector.
Current usage metrics show cumulative count of Article Views (full-text article views including HTML views, PDF and ePub downloads, according to the available data) and Abstracts Views on Vision4Press platform.
Data correspond to usage on the plateform after 2015. The current usage metrics is available 48-96 hours after online publication and is updated daily on week days.
Initial download of the metrics may take a while.