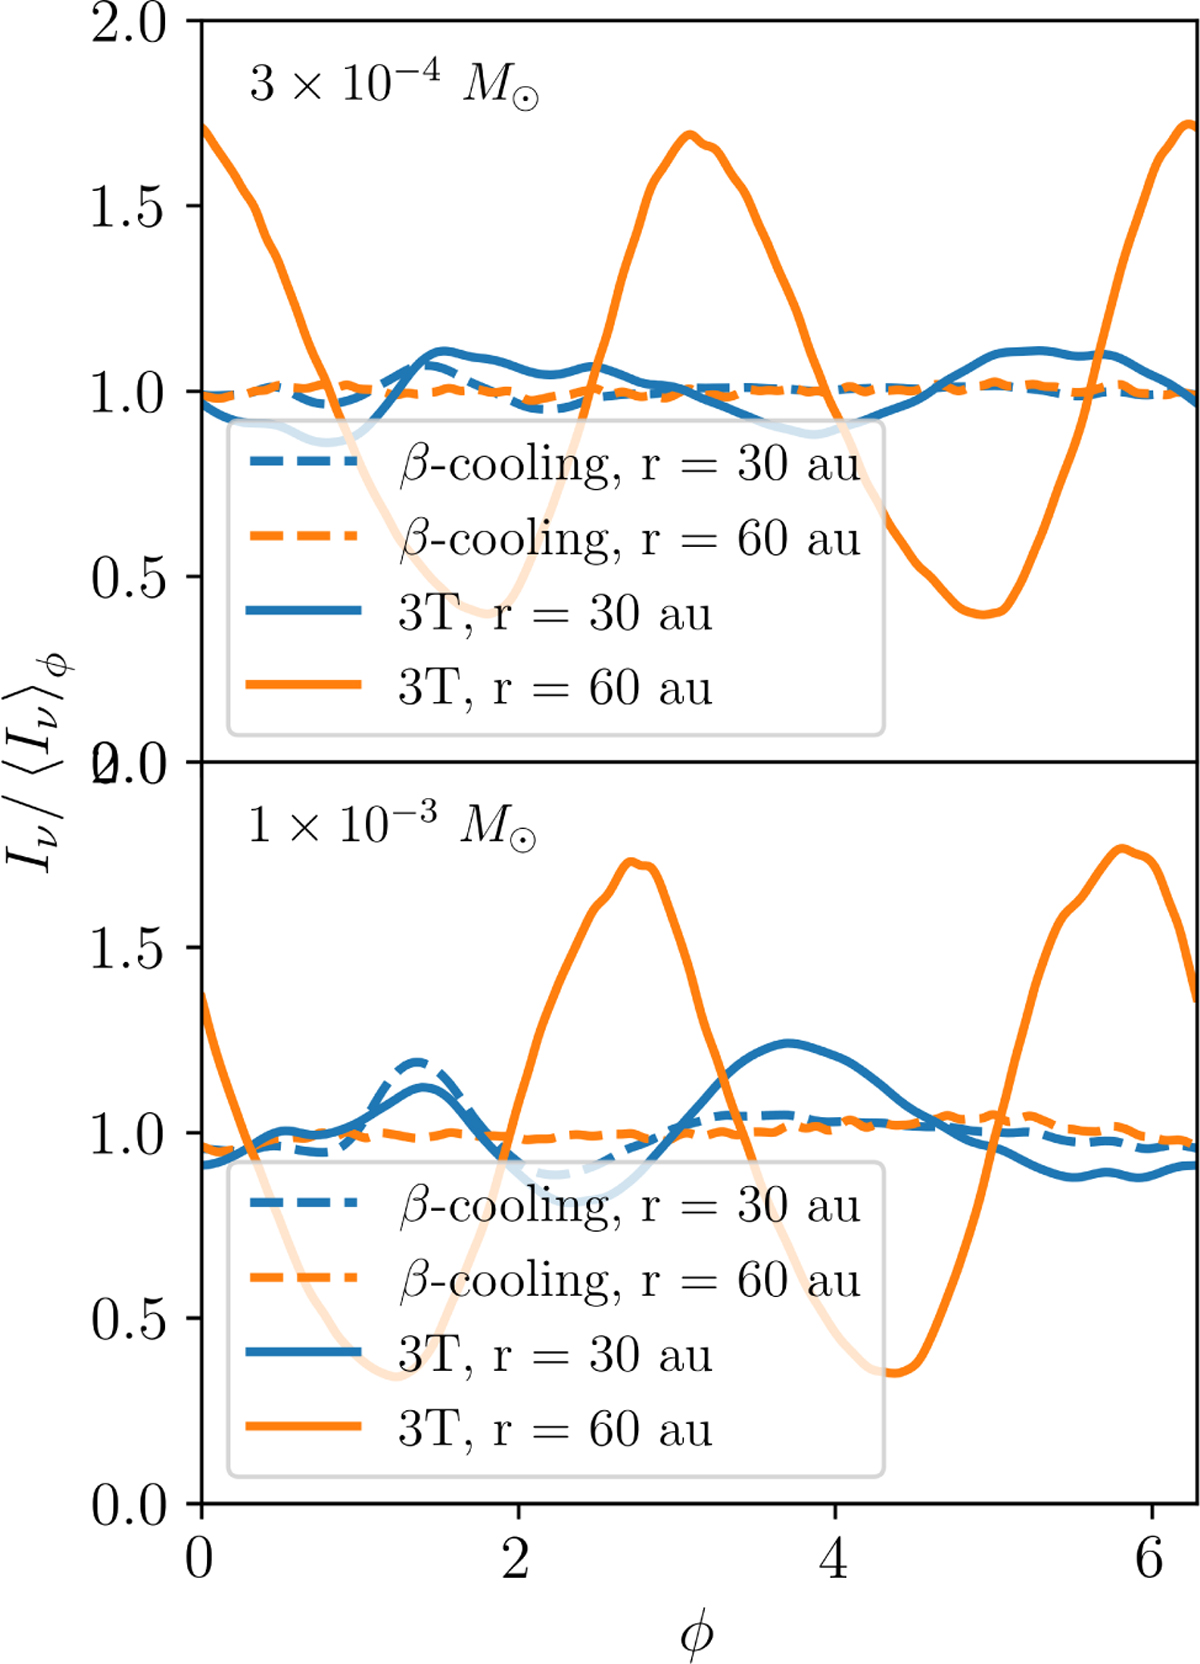
Fig. 5
Download original image
H-band intensity in all of our simulations, taken at fiducial radii rinner,cut = 30 au and router,cut = 60 au, and normalized to the azimuthal average. The 3T simulations show a clear m = 2 spiral with a peak-to-trough intensity ratio ~4 in the outer disk and ~ 1.2–1.5 in the inner disk. By contrast, the β-cooling simulations show negligible asymmetry in the outer disk, alongside asymmetries of ~ 1.1–1.5 in the inner disk caused by inner Lindblad spirals.
Current usage metrics show cumulative count of Article Views (full-text article views including HTML views, PDF and ePub downloads, according to the available data) and Abstracts Views on Vision4Press platform.
Data correspond to usage on the plateform after 2015. The current usage metrics is available 48-96 hours after online publication and is updated daily on week days.
Initial download of the metrics may take a while.