Fig. 1
Download original image
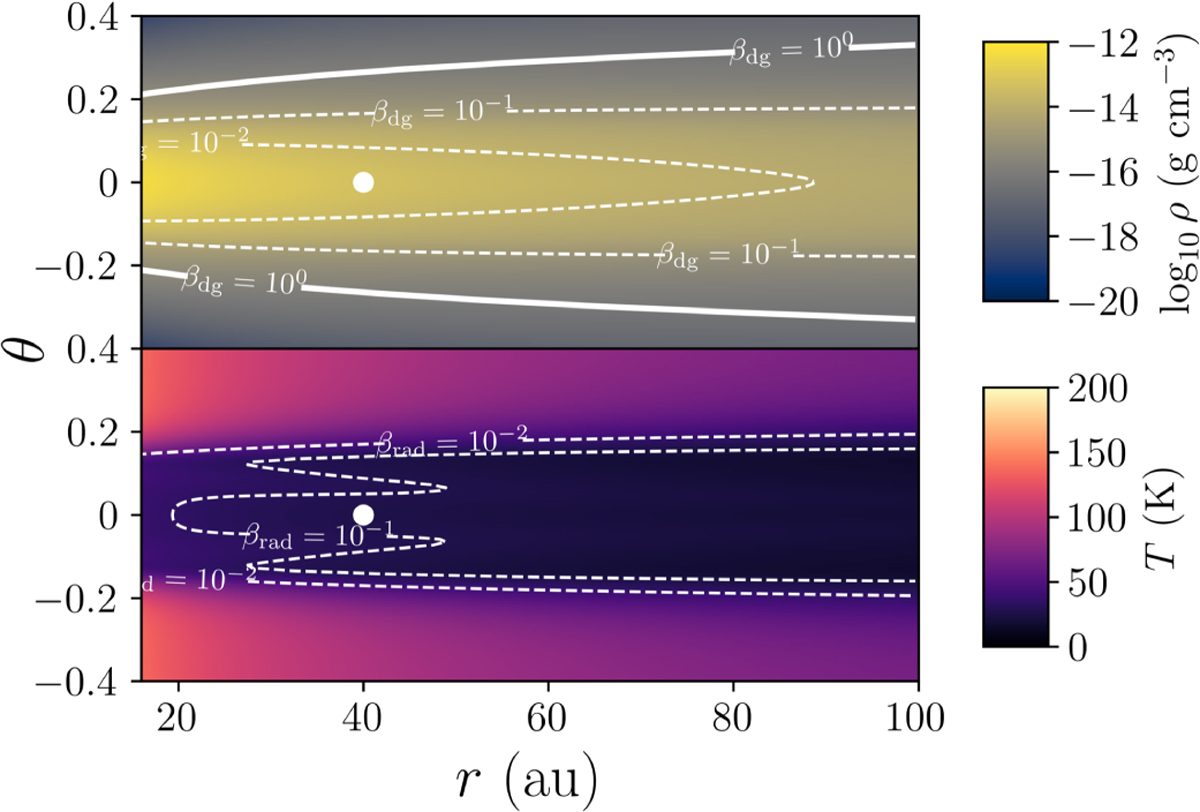
Initial conditions for gas density ρ (above), and the dust and gas temperatures Td and T𝑔 (below), which are initially equal. The contours for normalized cooling timescales from gas-grain collision (βdg) are plotted above and those from radiation (βrad) below, with white lines. The figure is exactly reproduced from Muley et al. (2024).
Current usage metrics show cumulative count of Article Views (full-text article views including HTML views, PDF and ePub downloads, according to the available data) and Abstracts Views on Vision4Press platform.
Data correspond to usage on the plateform after 2015. The current usage metrics is available 48-96 hours after online publication and is updated daily on week days.
Initial download of the metrics may take a while.